¹³C-NMR Peak Identification Tool Helping assign experimental ¹³C-NMR peaks to their most likely structural environments
Demo version — learn how the tool works before registering.
What Is the ¹³C-NMR Peak Identification Tool?
The MID ¹³C-NMR Peak Identification Tool is a computational platform designed to interpret ¹³C-NMR spectral data and relate experimental signals to their most probable molecular environments.
The tool analyzes chemical shifts (ppm) associated with individual carbon signals. Each ppm vale is used to generate a molecular graph that represents the atomic environment of the carbon atoms associated with that signal. The tool employs a highly efficient algorithm that identifies the most probable structures by comparing experimental data with a large reference database.
This database, built using high-precision density functional theory (DFT) calculations, contains over 100,000 unique atomic environments covering the full ¹³C-NMR spectral range. Each dataset has been carefully selected to ensure accuracy and representativity.
Additionally, the database can be filtered according to different solvent models, improving prediction accuracy by accounting for molecular interactions with the solvent.
What the Tool Allows You to Explore
Using experimental-style NMR information, the tool evaluates how individual carbon signals can be mapped onto specific molecular environments.
For each signal, the tool generates multiple candidate molecular graphs representing plausible local atomic environments. These candidates are automatically ranked by likelihood, allowing direct comparison between alternative interpretations.
Why Use this Tool
By linking experimental NMR signals directly to probable molecular environments, the tool helps bridge the gap between raw spectral data and structural reasoning.
In its full version, this approach supports rapid hypothesis testing, structure validation, and comparative analysis, making it particularly valuable for education, research, and early-stage structure elucidation.
Propionaldehyde
This example illustrates the use of the MID ¹³C-NMR Peak Identification Tool using the experimental ¹³C-NMR spectrum of Propionaldehyde (N-[3-(1-ethyl-1-methylpropyl)-1,2-oxazol-5-yl]-2,6-dimethoxybenzamide) recorded in chloroform (CDCl3). This example illustrates the use of the MID ¹³C-NMR Peak Identification Tool using the experimental ¹³C-NMR spectrum of Propionaldehyde (propanal) recorded in chloroform (CDCl3).
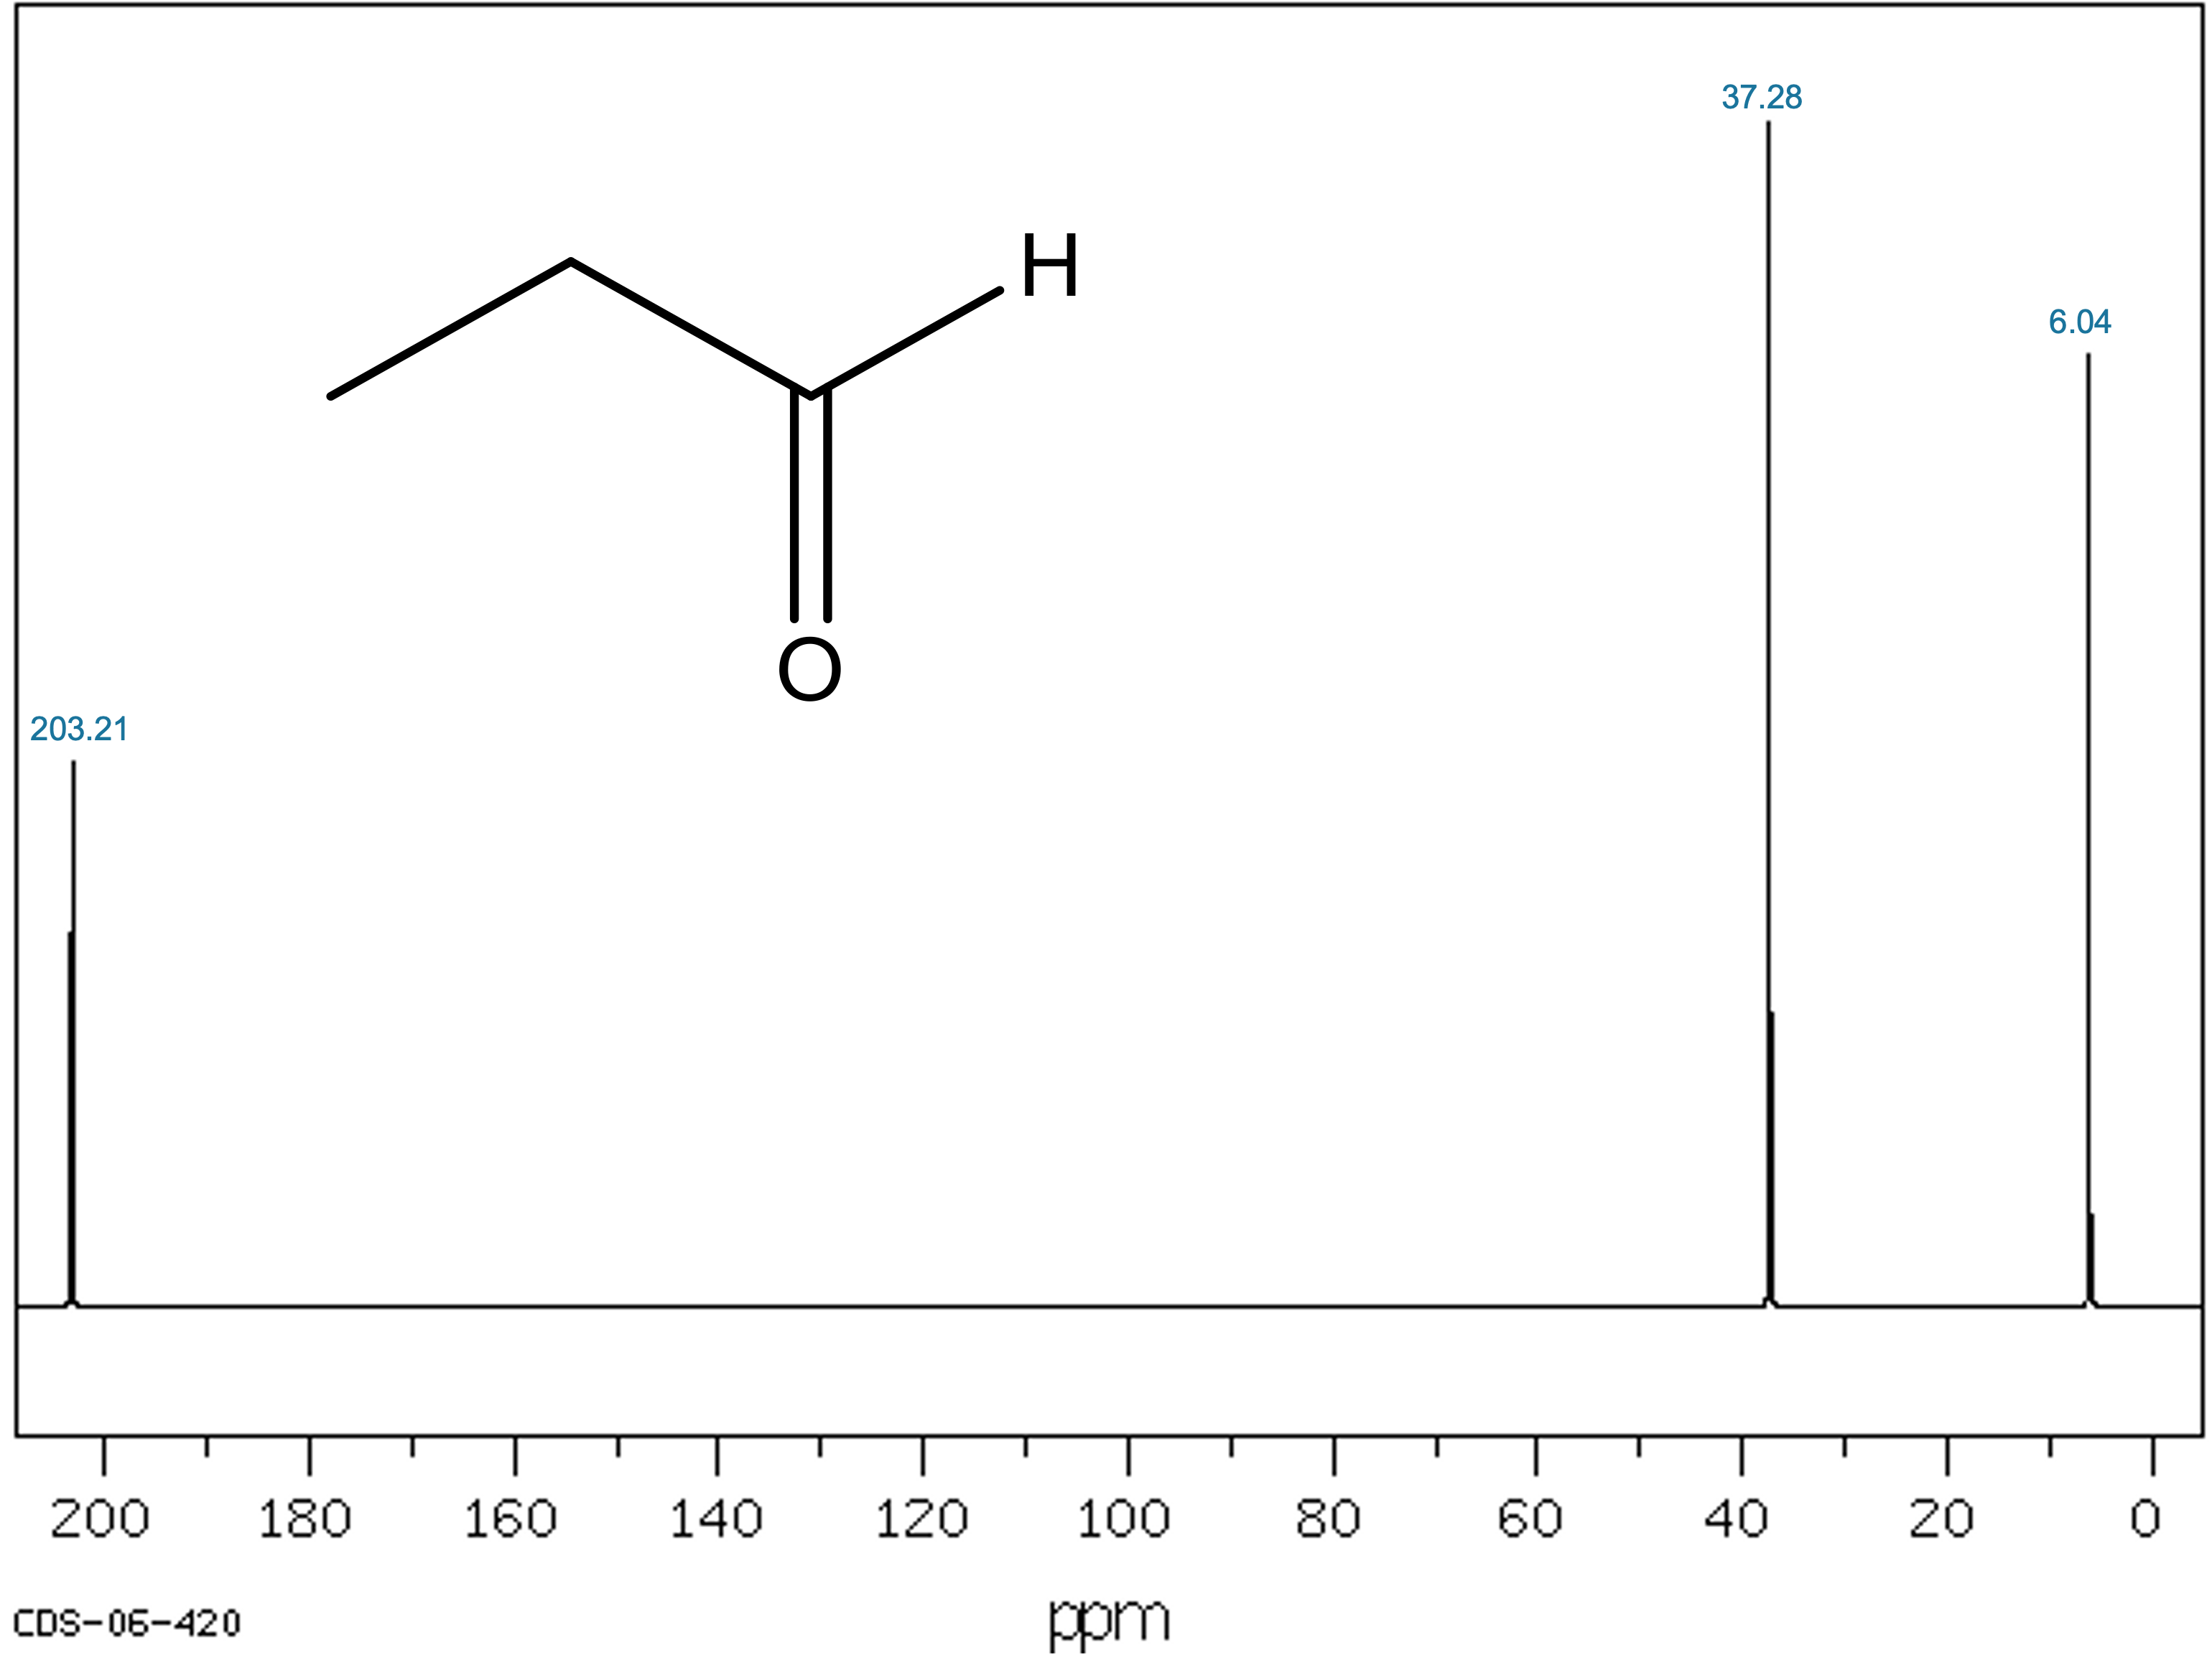
Figure 1. Experimental ¹³C-NMR spectrum of Propionaldehyde (AIST/SDBS). Chemical shifts with thir corresponding integral are indicated.
Step 1: Solvent Selection
The first and critically important step is to select the solvent used in the experimental spectrum within the MID application. Solvent effects must be considered because certain polar functional groups interact strongly with the solvent, which can significantly alter their local electronic environment and therefore their chemical shifts.
In this example, the experimental spectrum was recorded in CDCl3, and this solvent must be selected before entering any spectral data.
Step 2: Entering Chemical Shifts
Chemical shifts must be entered into the MID ¹³C-NMR tool one by one.
-
Chemical shifts should be entered with the highest possible precision
(three decimal places).
Example: enter203.21 ppm, not203.2 ppm. Do not round values. - Any number of signals can be added using the Add Peak button.
- Signals can be removed individually if corrections are needed.
In contrast to ¹H-NMR analysis, integral values are not required for ¹³C-NMR. Each resolved carbon signal is entered once using only its chemical shift value.
The Propionaldehyde spectrum contains three distinct signals:
| Chemical Shift (ppm) |
|---|
203.21
|
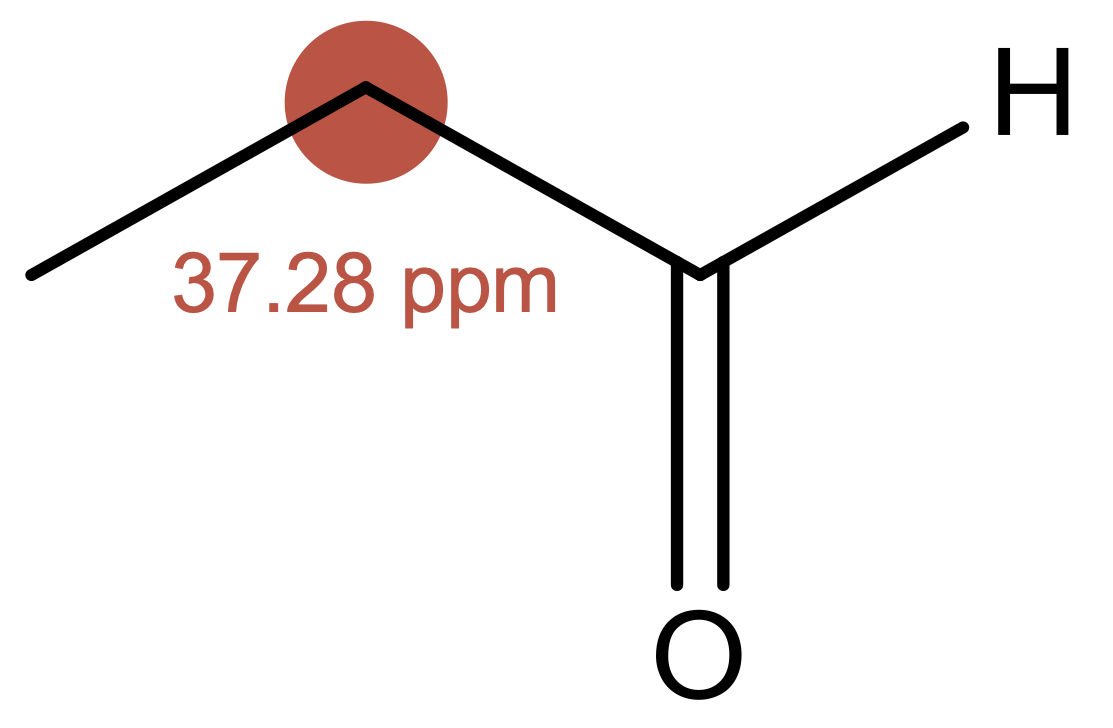
37.28
|
6.04
|
Step 3: Generating Molecular Fragments
Once all chemical shifts and integrals have been correctly entered, molecular fragments are generated by clicking the Generate Plots button.
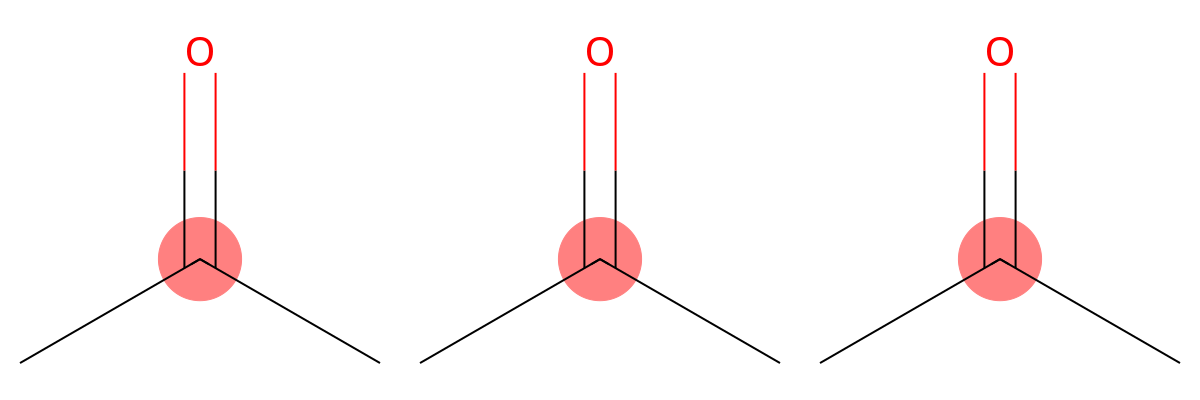
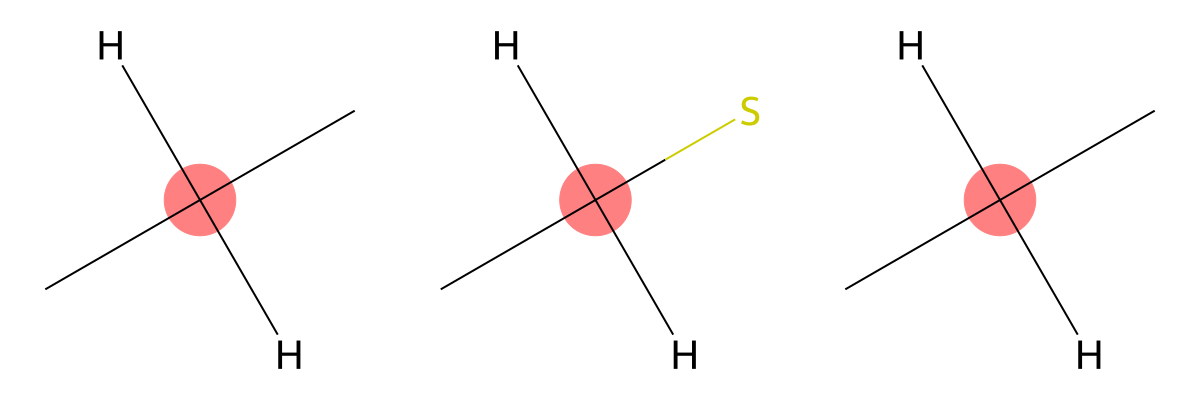
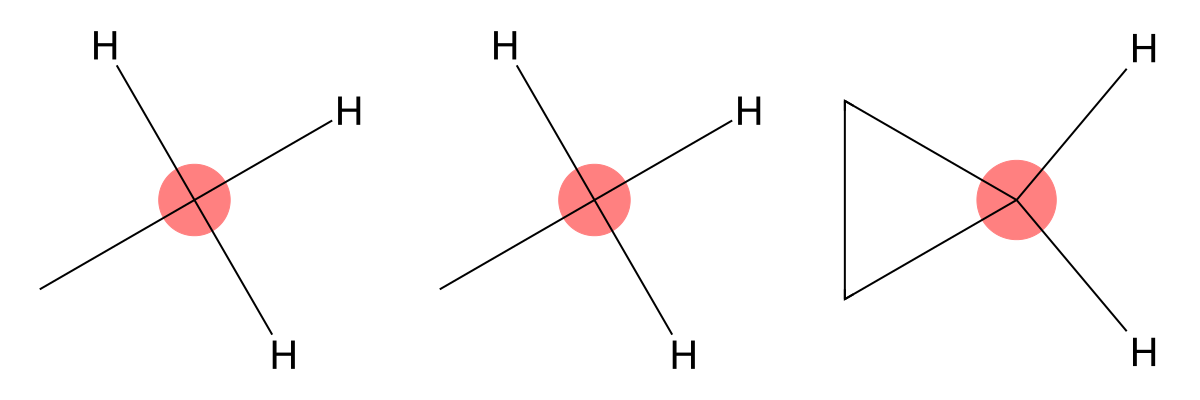
For each signal, the tool displays the three most probable molecular environments, ordered from left (highest probability) to right (lowest probability).
Results and Experimental Validation
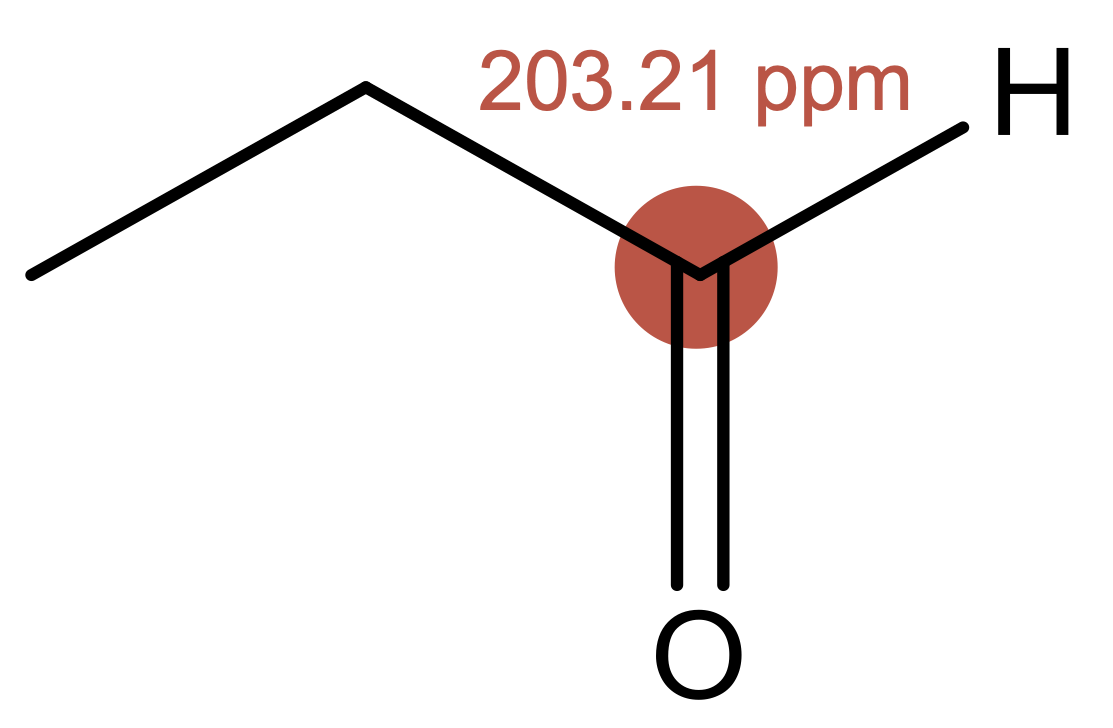
To verify the robustness of the MID methodology, each predicted carbon environment was compared with the experimentally assigned carbons in the Propionaldehyde molecule in chloroform.
Each figure pair shows the MID-predicted molecular fragments for a given carbon signal alongside the experimentally assigned carbon environment, demonstrating strong agreement between prediction and experiment.
Predicted vs Experimental Assignments
| Chemical shift (ppm) | Prediction | Experimental assignment | Notes |
|---|---|---|---|
203.21
|
|
|
MID correctly identifies this signal as a carbonyl carbon (C=O), which appears strongly deshielded in ¹³C-NMR spectra. |
37.28
|
|
|
The predicted environment corresponds to a methylene carbon (CH2), consistent with experimental assignment. |
6.04
|
|

|
MID assigns this signal to a terminal methyl carbon (CH3), which appears upfield due to its electron-rich aliphatic environment. |