¹H-NMR Peak Identification Tool Helping assign experimental ¹H-NMR peaks to their most likely structural environments
Demo version — learn how the tool works before registering.
What Is the ¹H-NMR Peak Identification Tool?
The MID ¹H-NMR Peak Identification Tool is a computational platform designed to interpret ¹H-NMR spectral data and relate experimental signals to their most probable molecular environments.
The tool analyzes chemical shifts (ppm) and integral values associated with individual proton signals. Each combination of ppm and integral values is used to generate a molecular graph that represents the atomic environment of the hydrogen atoms associated with that signal. The tool employs a highly efficient algorithm that identifies the most probable structures by comparing experimental data with a large reference database.
This database, built using high-precision density functional theory (DFT) calculations, contains over 100,000 unique atomic environments covering the full ¹H-NMR spectral range. Each dataset has been carefully selected to ensure accuracy and representativity.
Additionally, the database can be filtered according to different solvent models, improving prediction accuracy by accounting for molecular interactions with the solvent.
What the Tool Allows You to Explore
Using experimental-style NMR information, the tool evaluates how individual proton signals can be mapped onto specific molecular environments.
Relative integral values are interpreted to distinguish between different structural motifs, such as equivalent CH and CH₂ groups, enabling chemically meaningful comparisons between possible signal assignments.
For each signal, the tool generates multiple candidate molecular graphs representing plausible local atomic environments. These candidates are automatically ranked by likelihood, allowing direct comparison between alternative interpretations.
Why Use this Tool
By linking experimental NMR signals directly to probable molecular environments, the tool helps bridge the gap between raw spectral data and structural reasoning.
In its full version, this approach supports rapid hypothesis testing, structure validation, and comparative analysis, making it particularly valuable for education, research, and early-stage structure elucidation.
Isoxaben
This example illustrates the use of the MID ¹H-NMR Peak Identification Tool using the experimental ¹H-NMR spectrum of Isoxaben (N-[3-(1-ethyl-1-methylpropyl)-1,2-oxazol-5-yl]-2,6-dimethoxybenzamide) recorded in chloroform (CDCl3).
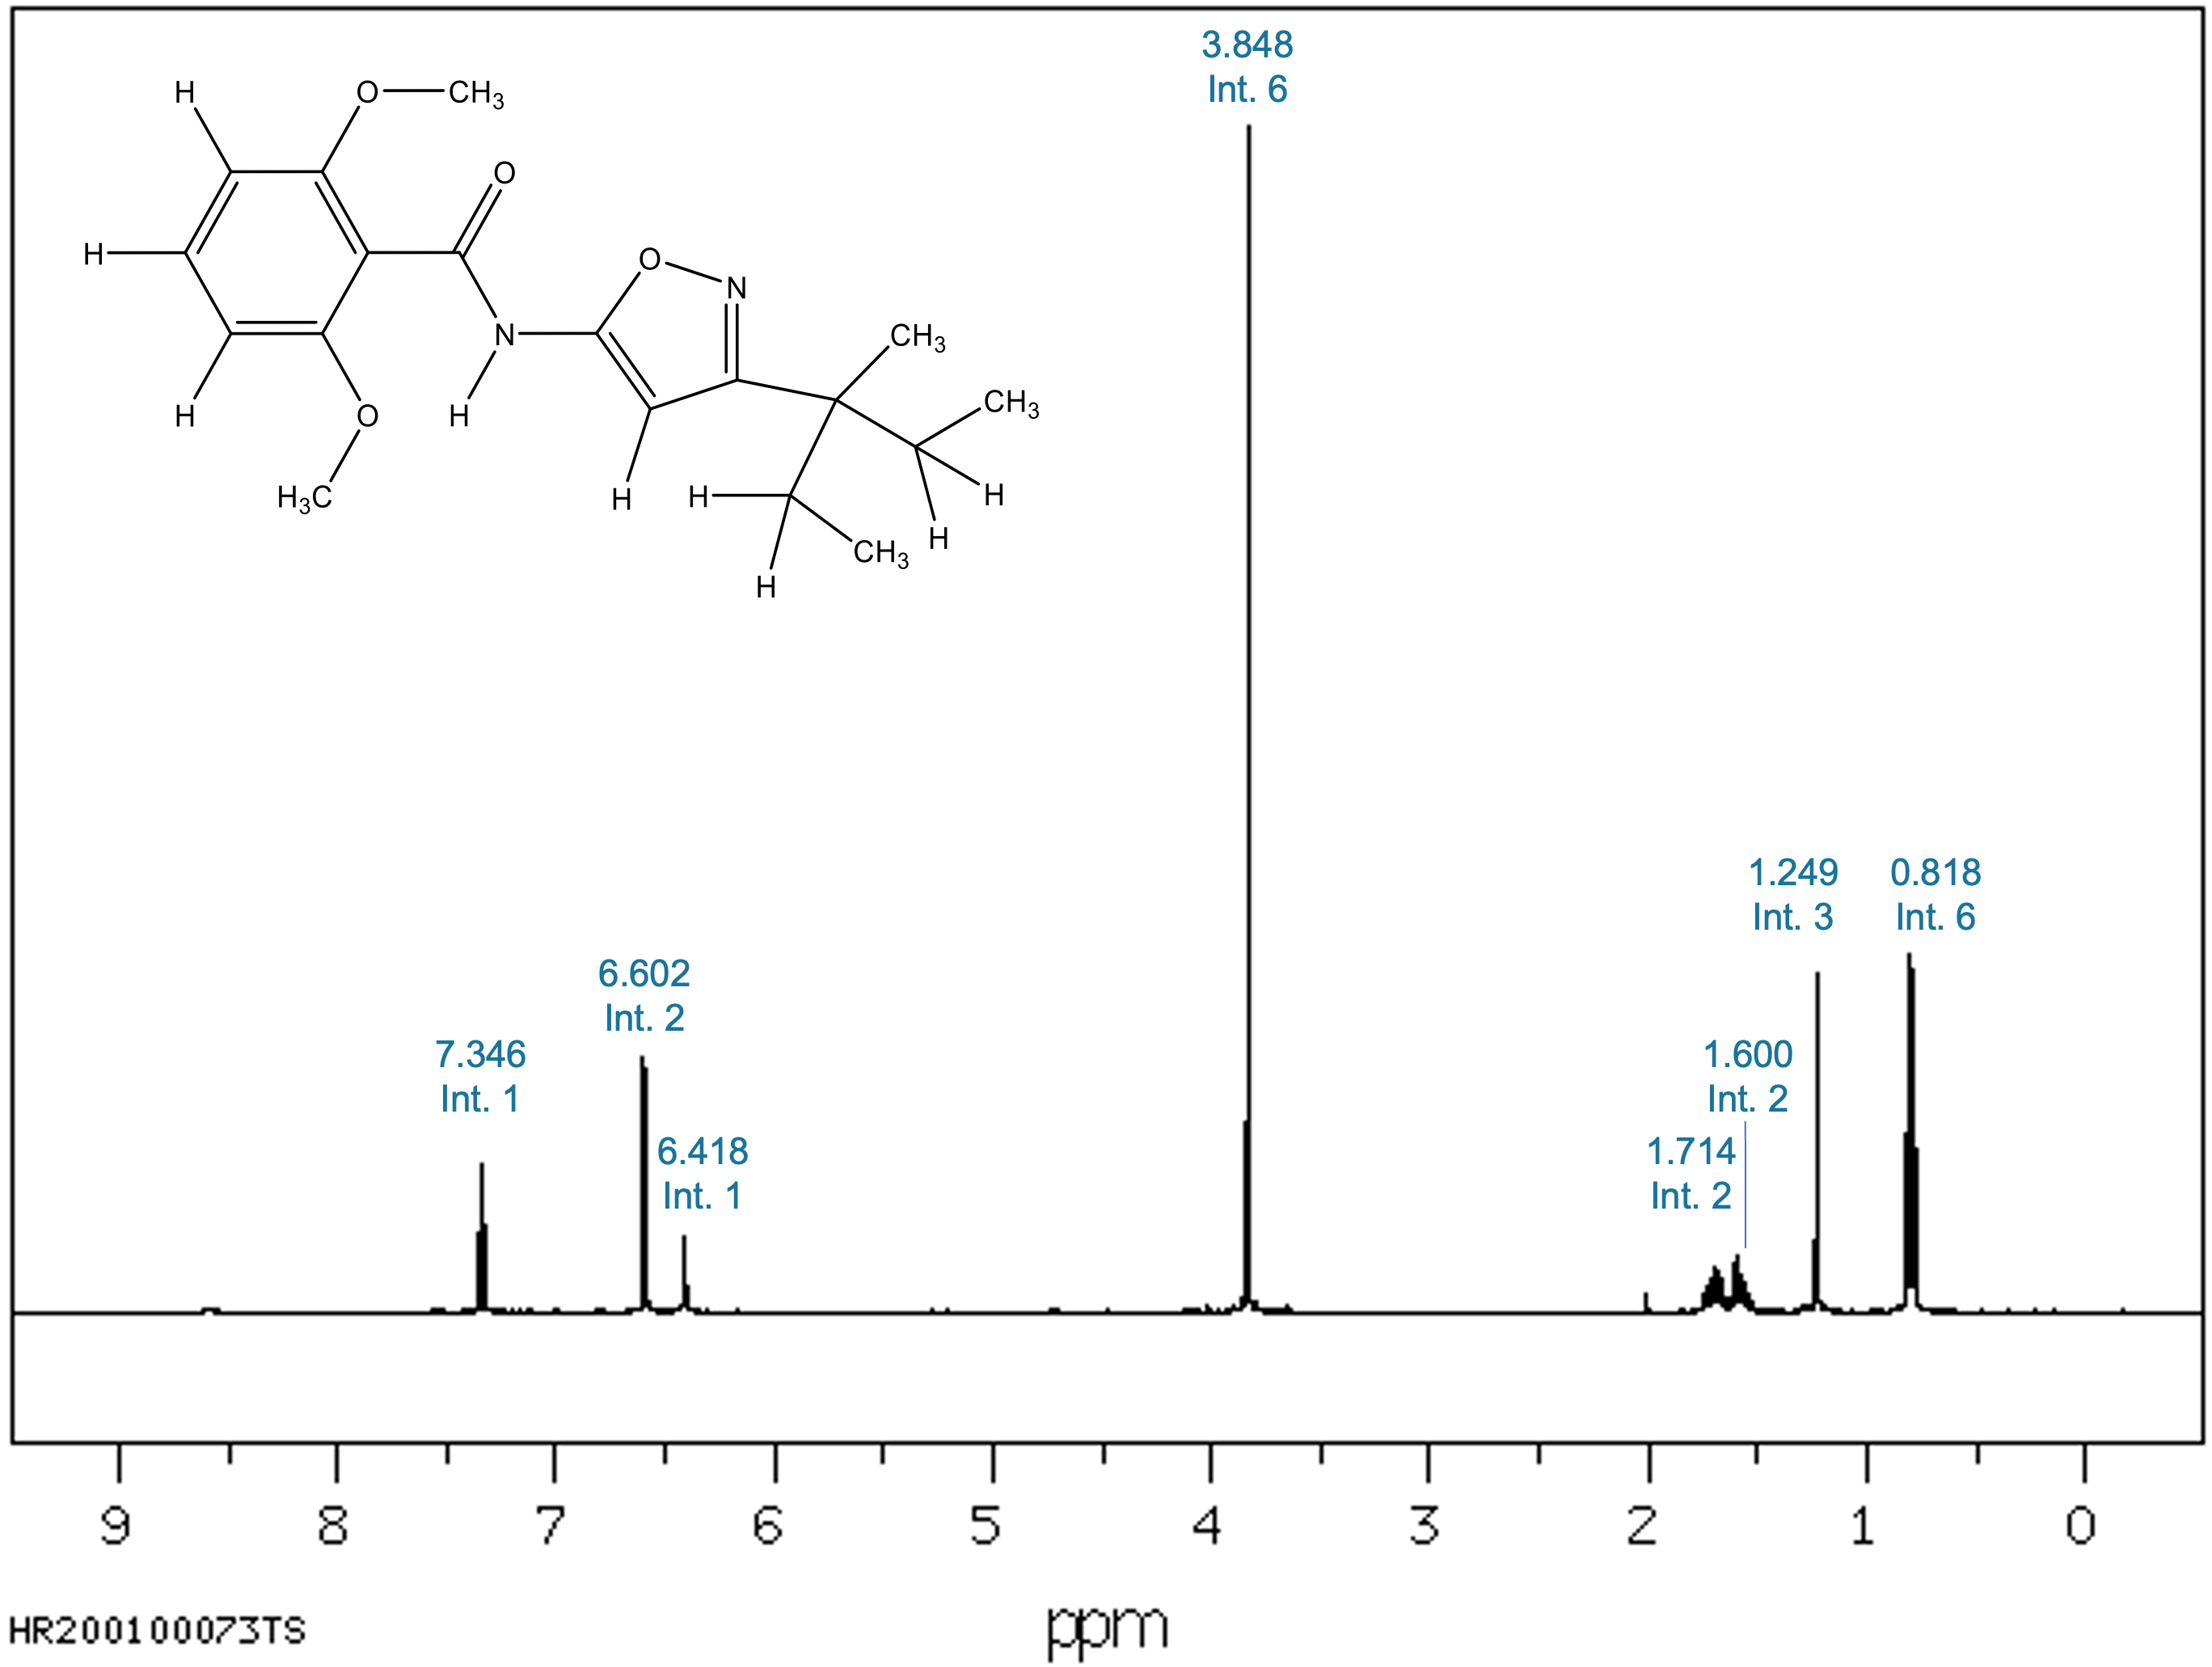
Figure 1. Experimental ¹H-NMR spectrum of Isoxaben (AIST/SDBS). Chemical shifts with thir corresponding integral are indicated.
Step 1: Solvent Selection
The first and critically important step is to select the solvent used in the experimental spectrum within the MID application. Solvent effects must be considered because certain polar functional groups interact strongly with the solvent, which can significantly alter their local electronic environment and therefore their chemical shifts.
In this example, the experimental spectrum was recorded in CDCl3, and this solvent must be selected before entering any spectral data.
Step 2: Entering Chemical Shifts and Integrals
Chemical shifts must be entered into the MID ¹H-NMR tool one by one.
-
Chemical shifts should be entered with the highest possible precision
(three decimal places).
Example: enter1.749 ppm, not1.75 ppm. Do not round values. - Any number of signals can be added using the Add Peak button.
- Signals can be removed individually if corrections are needed.
After entering the chemical shift, the integral value corresponding to that specific signal must be provided.
If a molecule contains equivalent proton groups, each equivalent group must be entered as a separate signal, even if the chemical shift is identical.
- For example, two equivalent methyl groups must be entered as two identical chemical shifts, each with an integral of 3, not a single signal with an integral of 6.
The Isoxaben spectrum contains eight distinct signals, each with a corresponding integral value:
| Chemical Shift (ppm) | Integral (H) |
|---|---|
7.346
|
1 H x 1 |
6.602
|
1 H x 2 |
6.418
|
1 H x 1 |
3.848
|
3 H x 2 |
1.714
|
2 H × 1 |
1.600
|
2 H × 1 |
1.249
|
3 H x 1 |
0.818
|
3 H × 2 |
Step 3: Generating Molecular Fragments
Once all chemical shifts and integrals have been correctly entered, molecular fragments are generated by clicking the Generate Plots button.
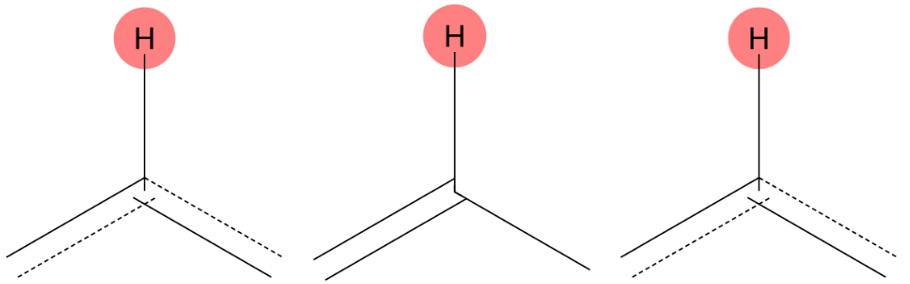
For each signal, the tool displays the three most probable molecular environments, ordered from left (highest probability) to right (lowest probability).
Results and Experimental Validation
To verify the robustness of the MID methodology, each predicted hydrogen environment was compared with the experimentally assigned protons in the Isoxaben molecule in chloroform.
Each figure pair shows the MID-predicted molecular fragments for a given proton signal alongside the experimentally assigned hydrogen environment, demonstrating strong agreement between prediction and experiment.
Predicted vs Experimental Assignments
| Chemical shift (ppm) | Prediction | Experimental assignment | Notes |
|---|---|---|---|
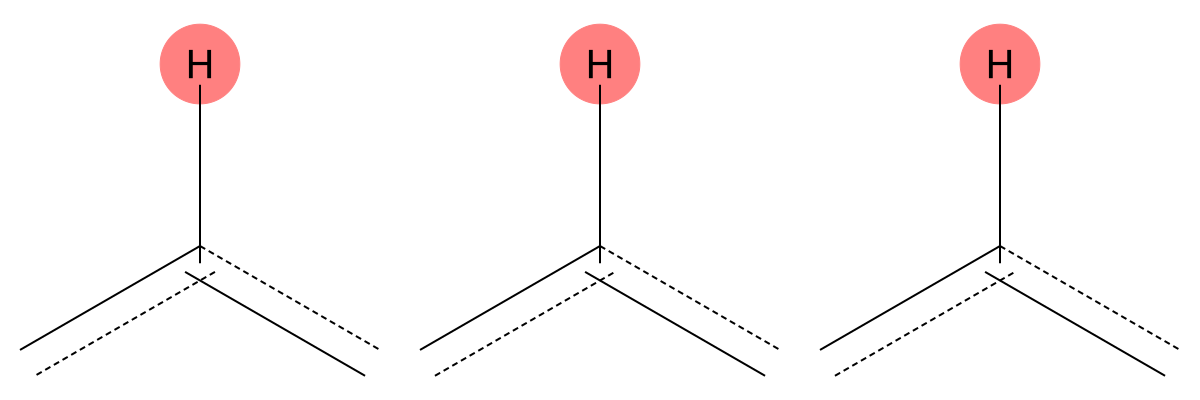
7.346 (1H)
|
|

|
MID correctly assigns this signal to a proton bonded to an aromatic carbon, in full agreement with the experimental assignment. |
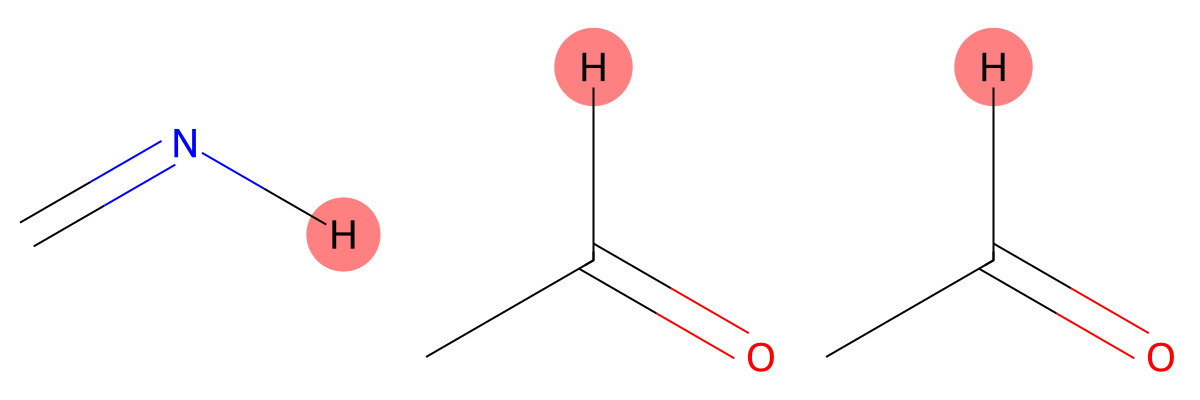
6.602 (1H)
|
|

|
The correct aromatic environment is not ranked first but appears as the third most probable prediction, indicating close proximity to the correct solution. |
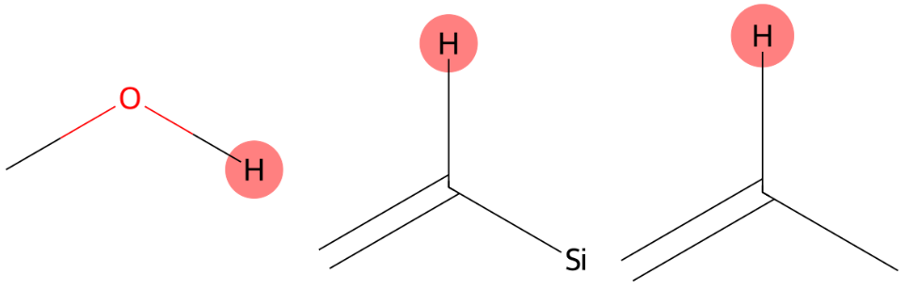
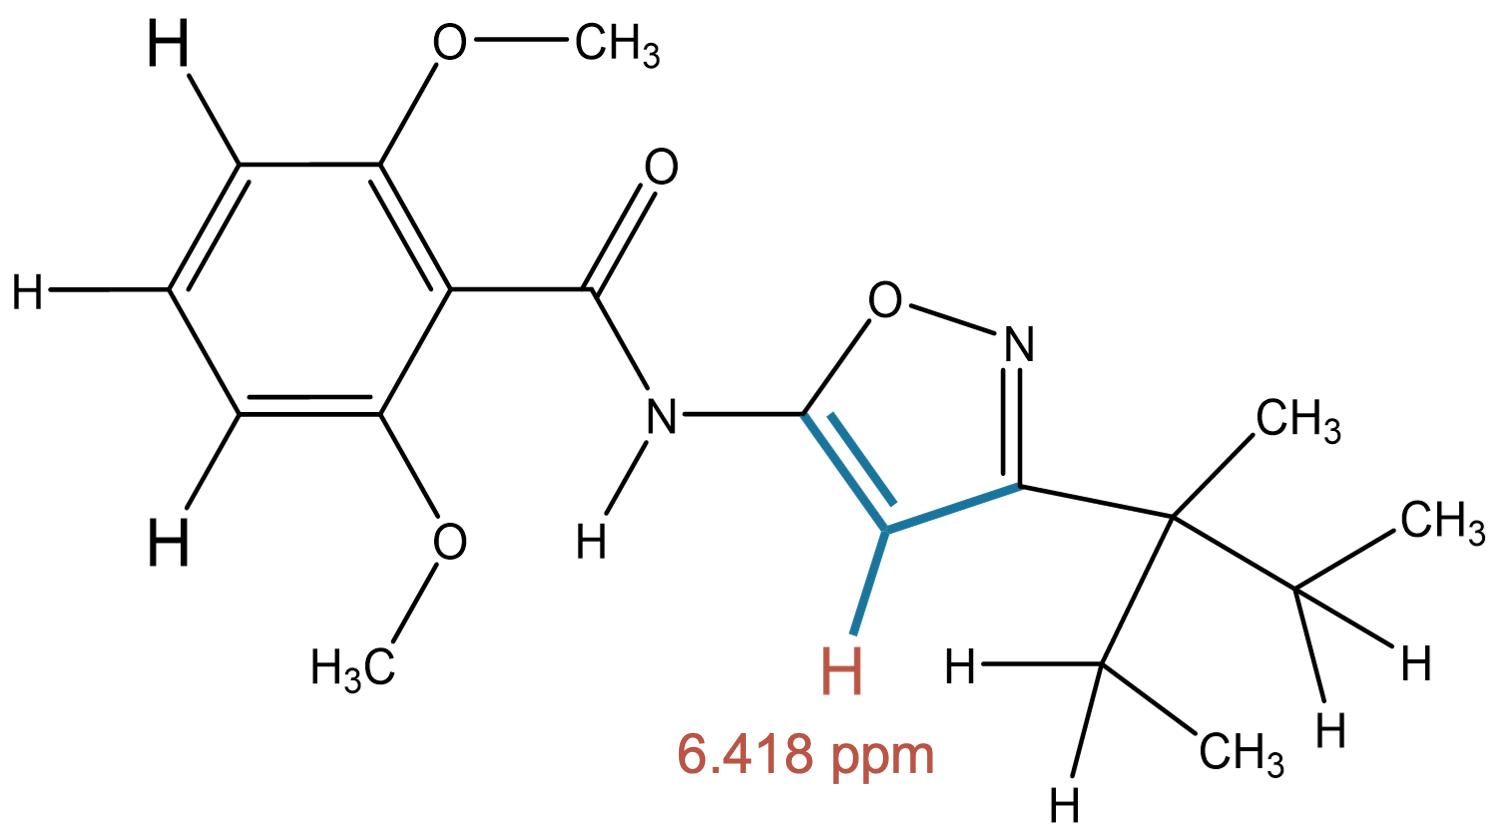
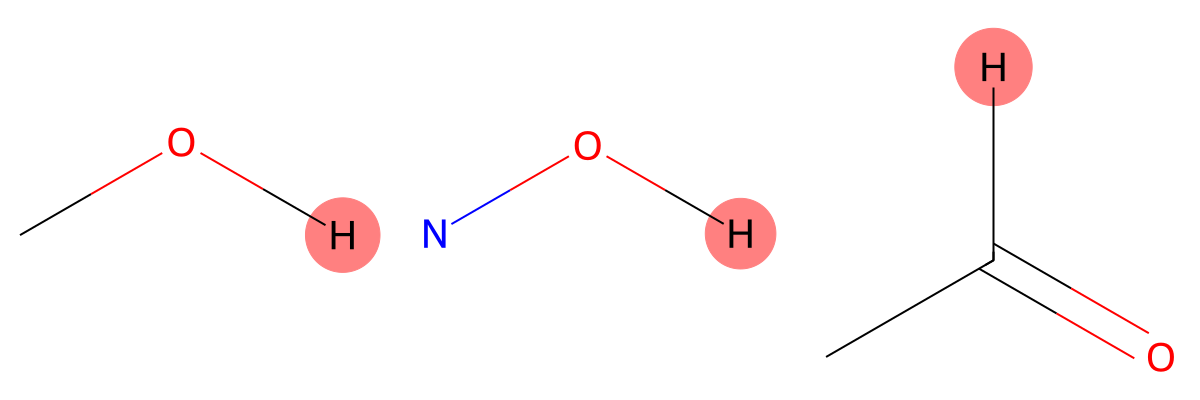
6.418 (1H)
|

|
|
MID predicts two closely related environments, one of which corresponds to the experimentally assigned hydrogen. |
3.848 (3H)
|
|
|
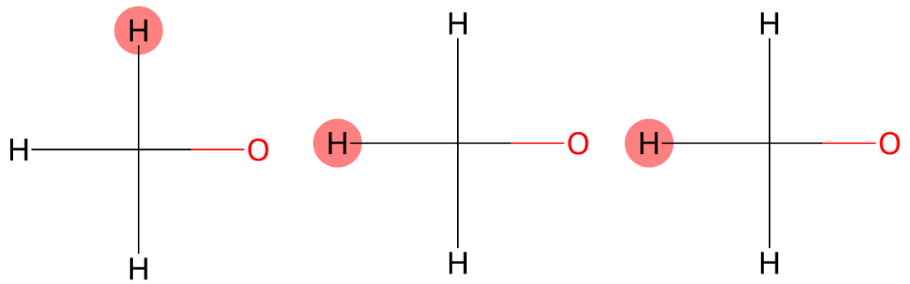
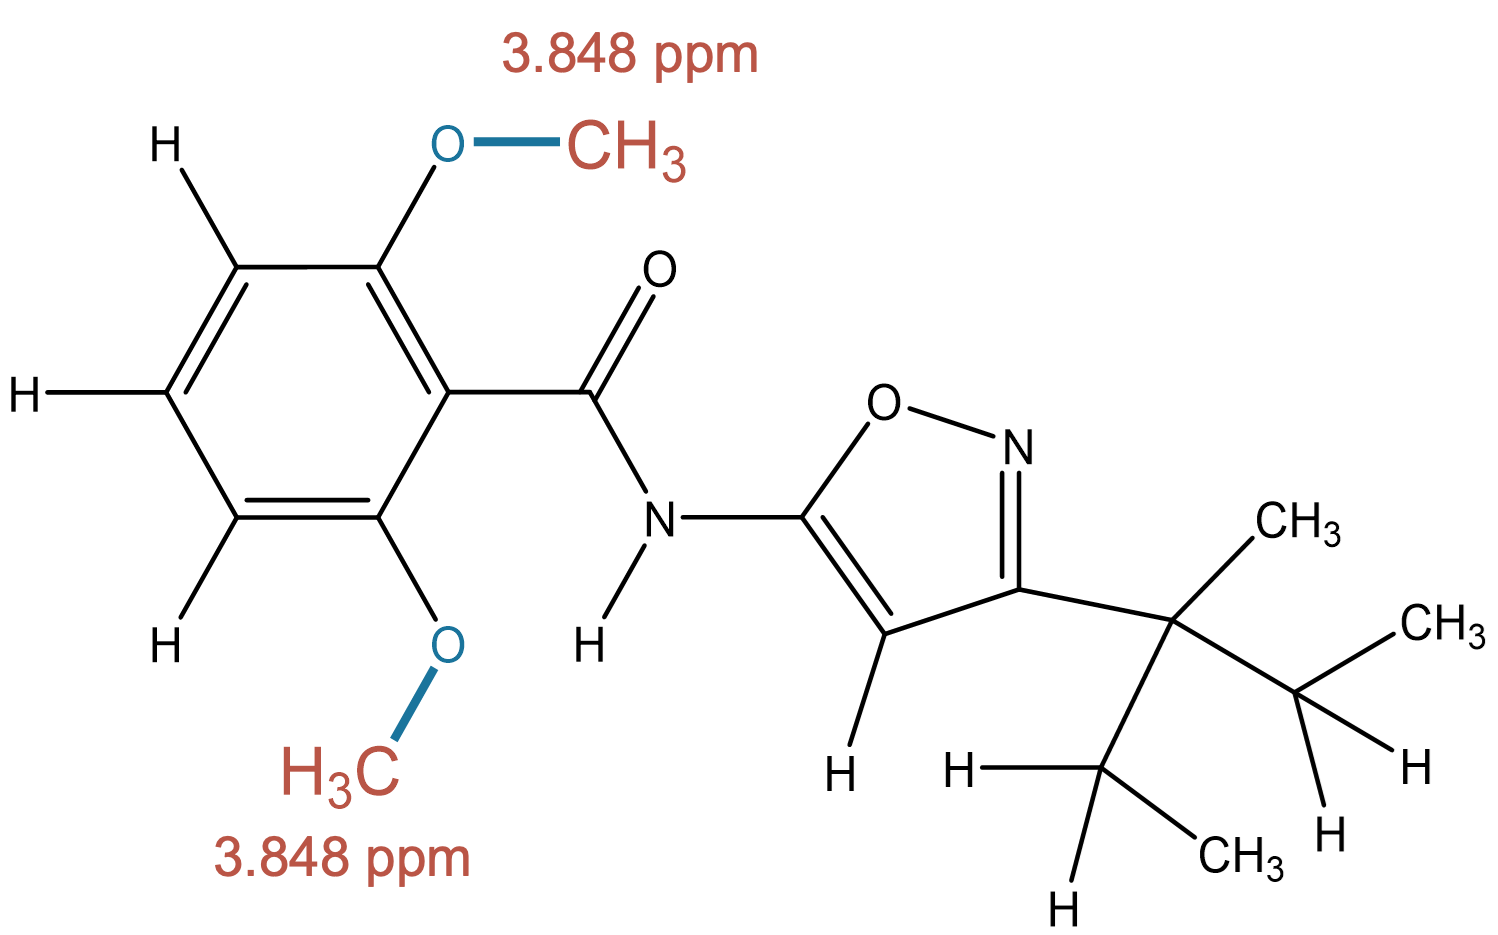
The signal is accurately predicted as a methyl group directly bonded to an oxygen atom (methoxy group). |
1.714 (2H)
|

|

|
MID correctly identifies a methylene group bonded to two carbon atoms, matching the experimental aliphatic environment. |
1.600 (2H)
|

|
|
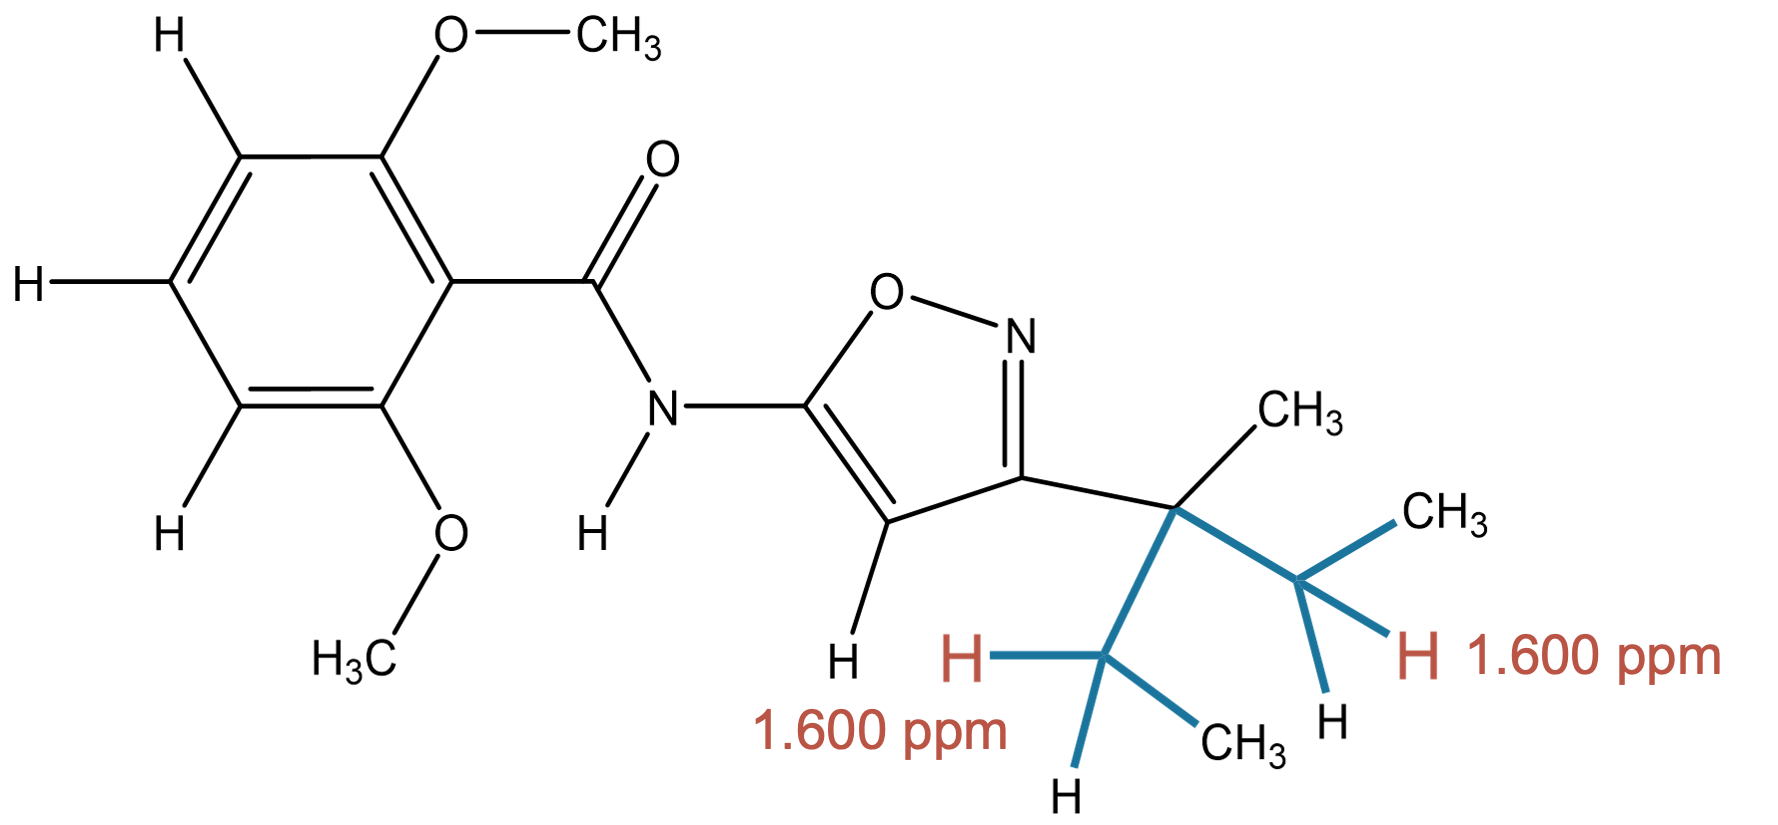
The predicted methylene environment is fully consistent with the experimental assignment. |
1.249 (3H)
|

|

|
MID accurately predicts a methyl group bonded to a carbon atom, in agreement with experiment. |
0.818 (3H)
|

|

|
The predicted methyl environment matches the experimental assignment for the 0.818 ppm signal. |
Aspirin
Here, the critical role of the solvent in accurate ¹H-NMR peak prediction using the MID ¹H-NMR tool is stressed using the experimental spectrum of acetylsalicylic acid (Aspirin) recorded in chloroform (CDCl3).
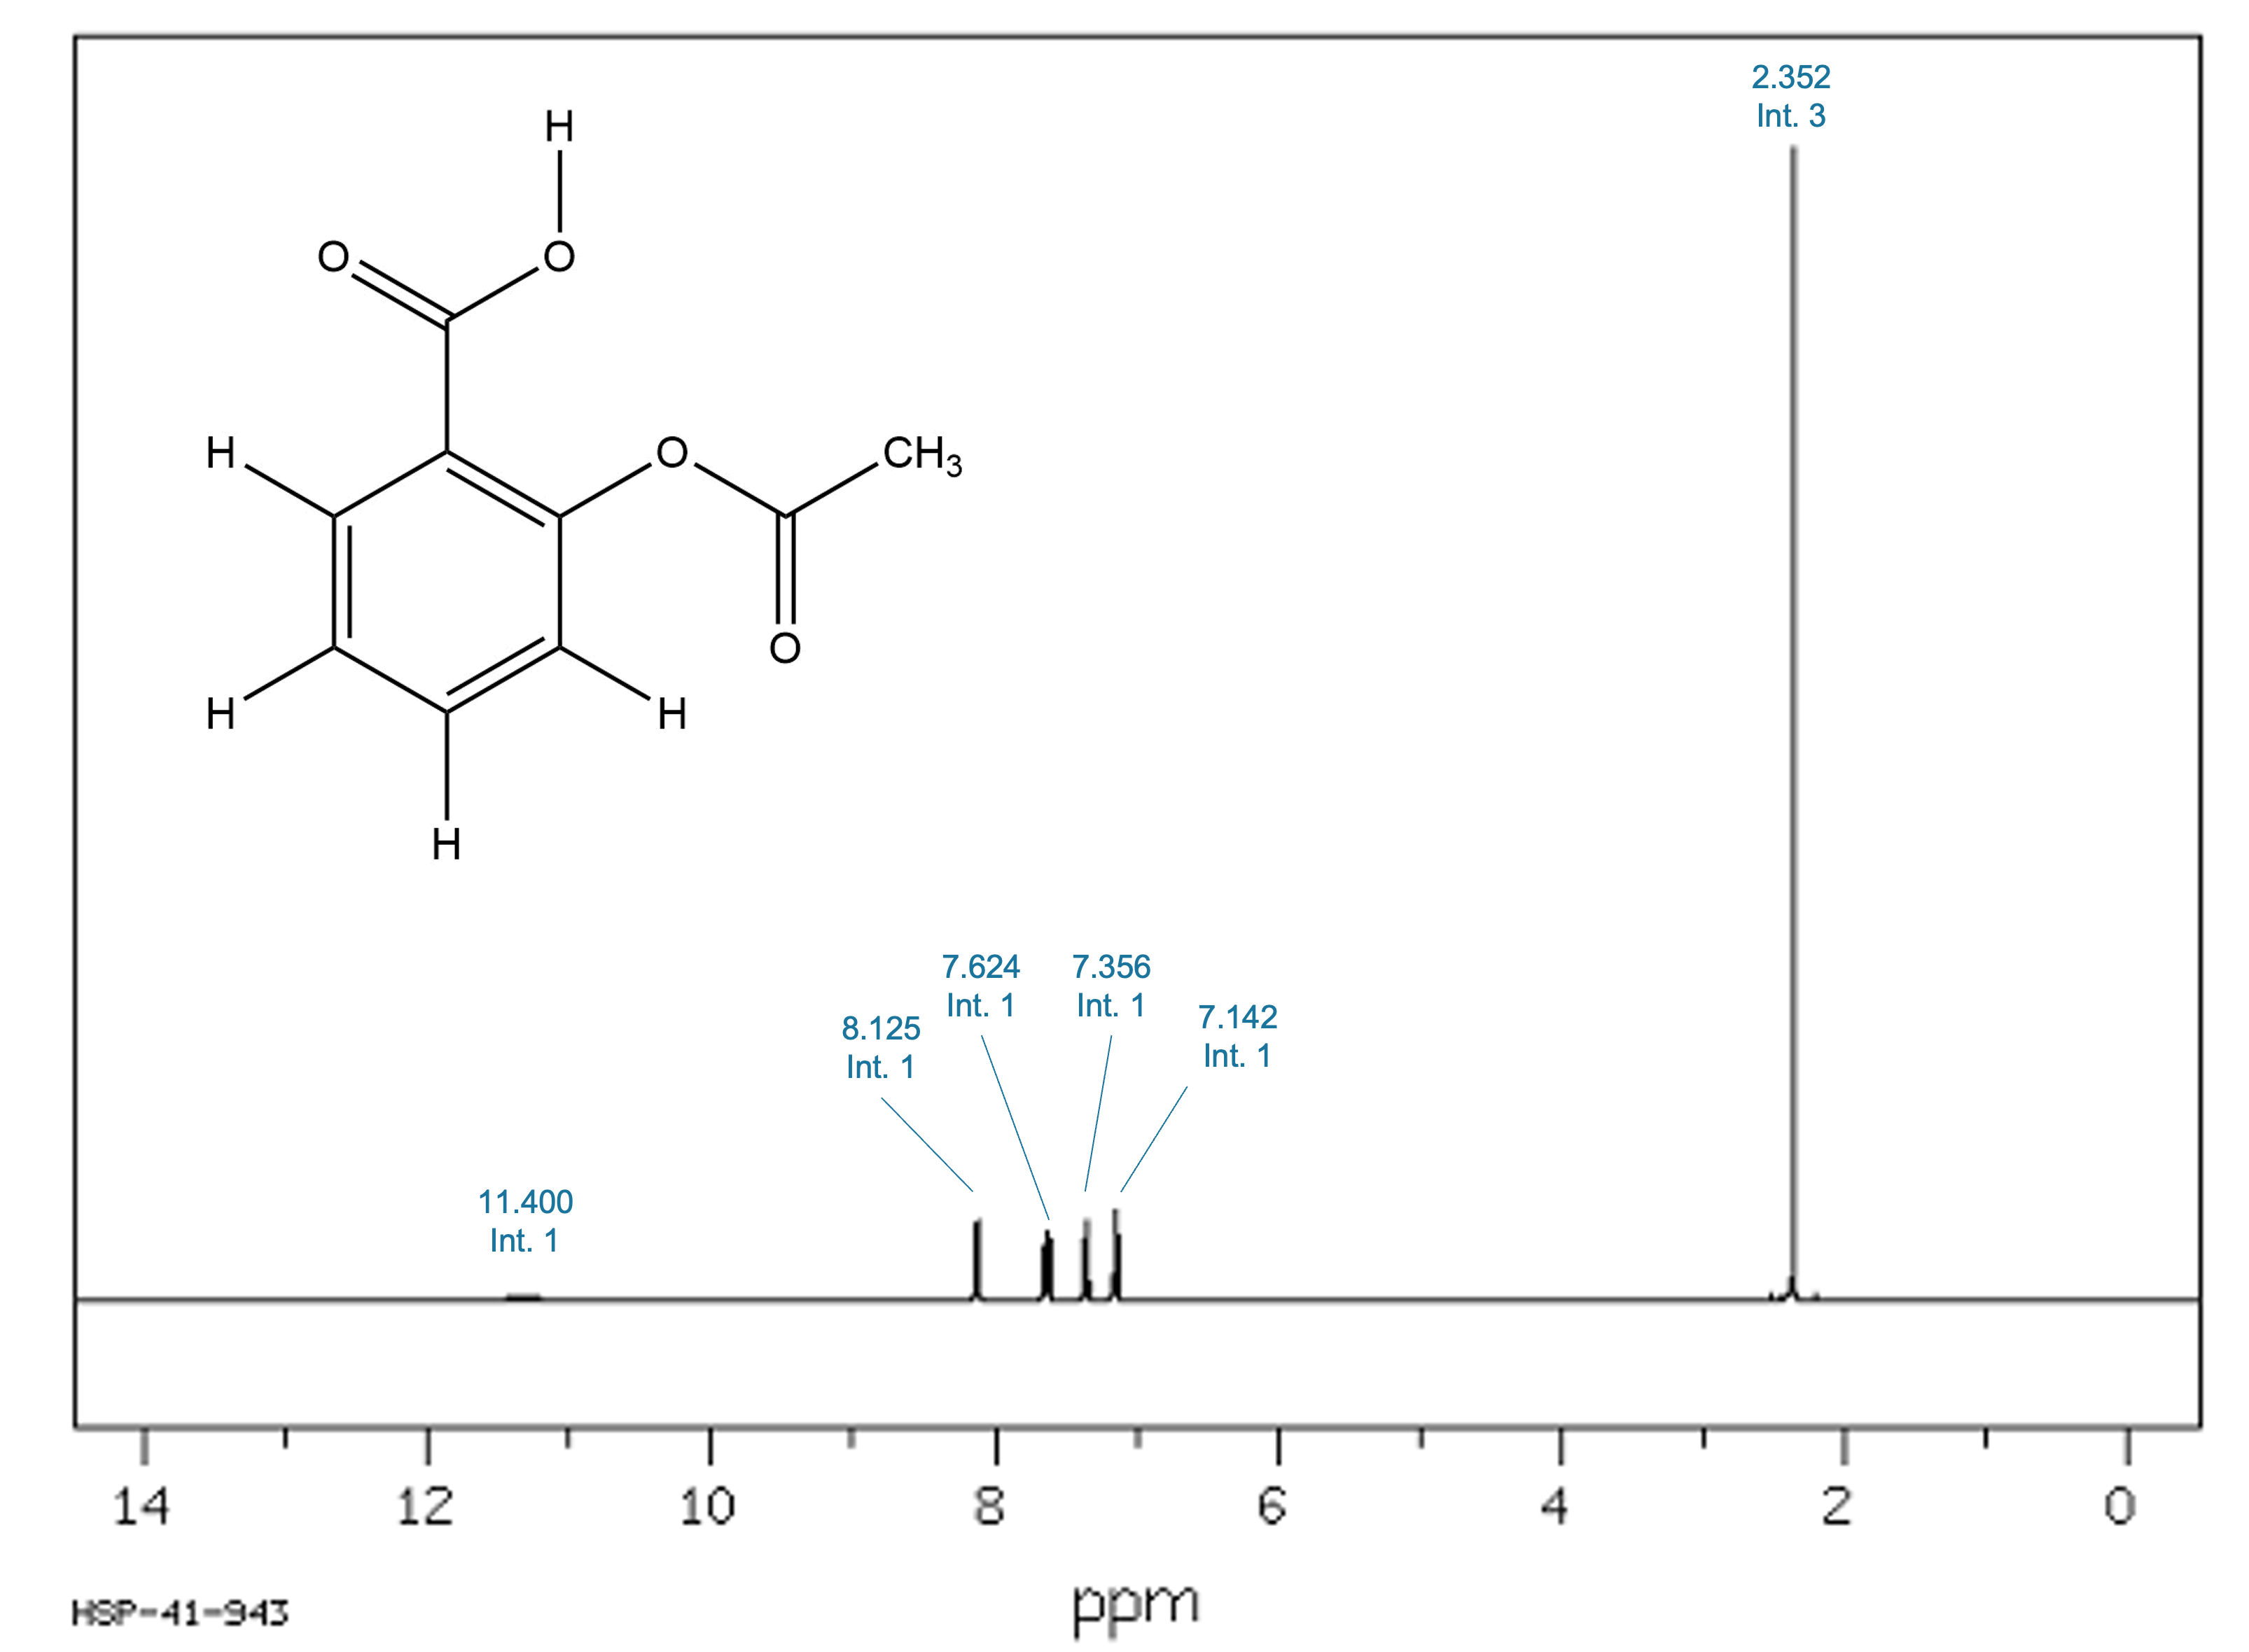
Figure 1. Experimental ¹H-NMR spectrum of Aspirin (AIST/SDBS). Chemical shifts with thir corresponding integral are indicated.
Aspirin contains strongly polar and acidic functional groups, most notably a carboxylic acid proton, whose chemical shift is highly sensitive to hydrogen bonding and solvent interactions. This makes Aspirin an ideal test case to demonstrate the limitations of gas-phase predictions and the improvement obtained when solvent effects are taken into account.
Predicted vs Experimental Assignments
| Chemical shift (ppm) |
Prediction (CHCl3) |
Prediction (gas phase) |
Experimental assignment | Notes |
|---|---|---|---|---|
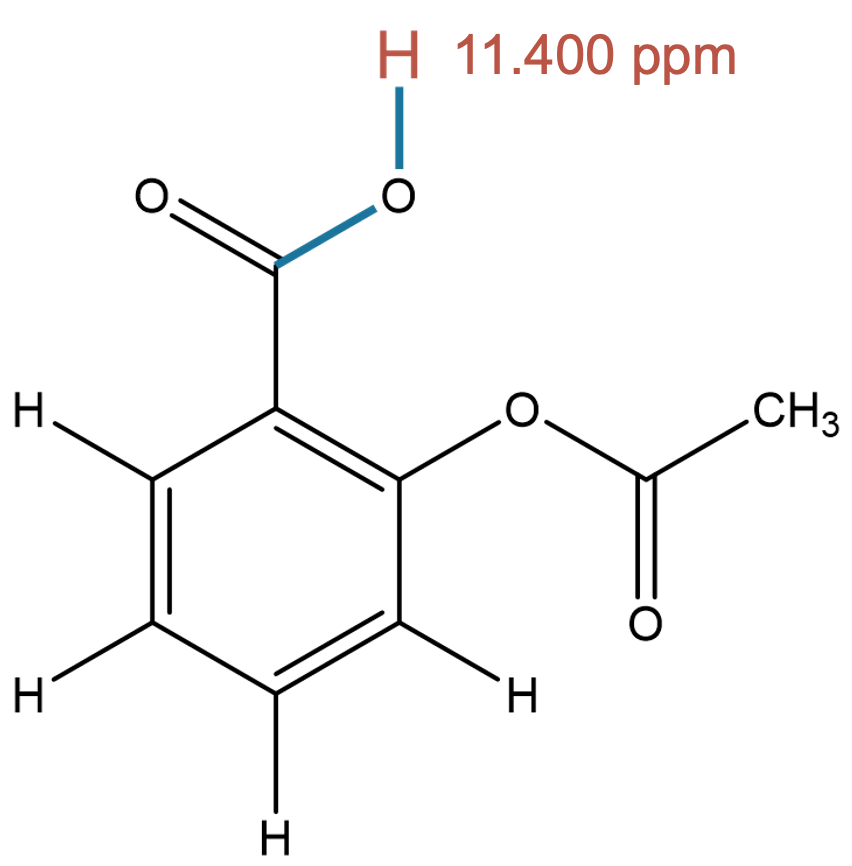
11.400 (1H)
|
|
|
|
The carboxylic acid proton is strongly influenced by solvent effects. MID reproduces the experimental environment more accurately when chloroform is included, highlighting the importance of solvent modeling for hydrogen-bonded protons. |
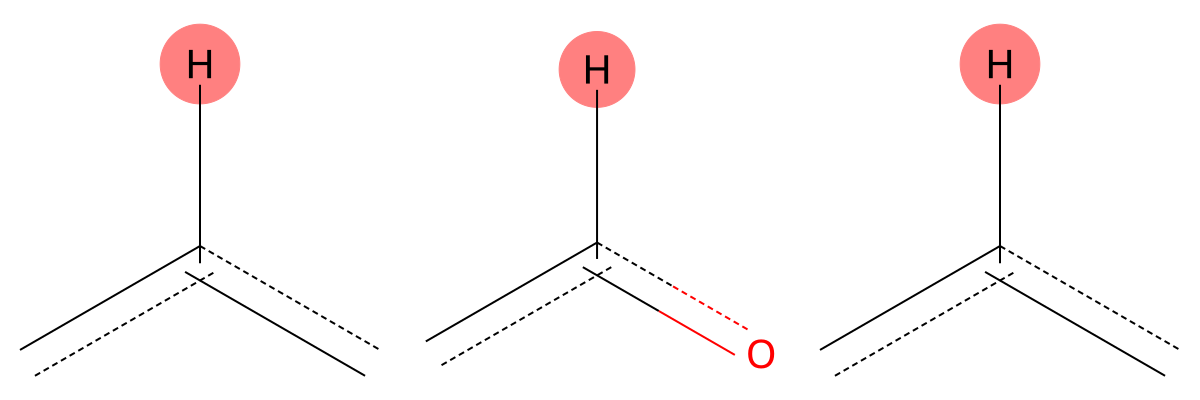
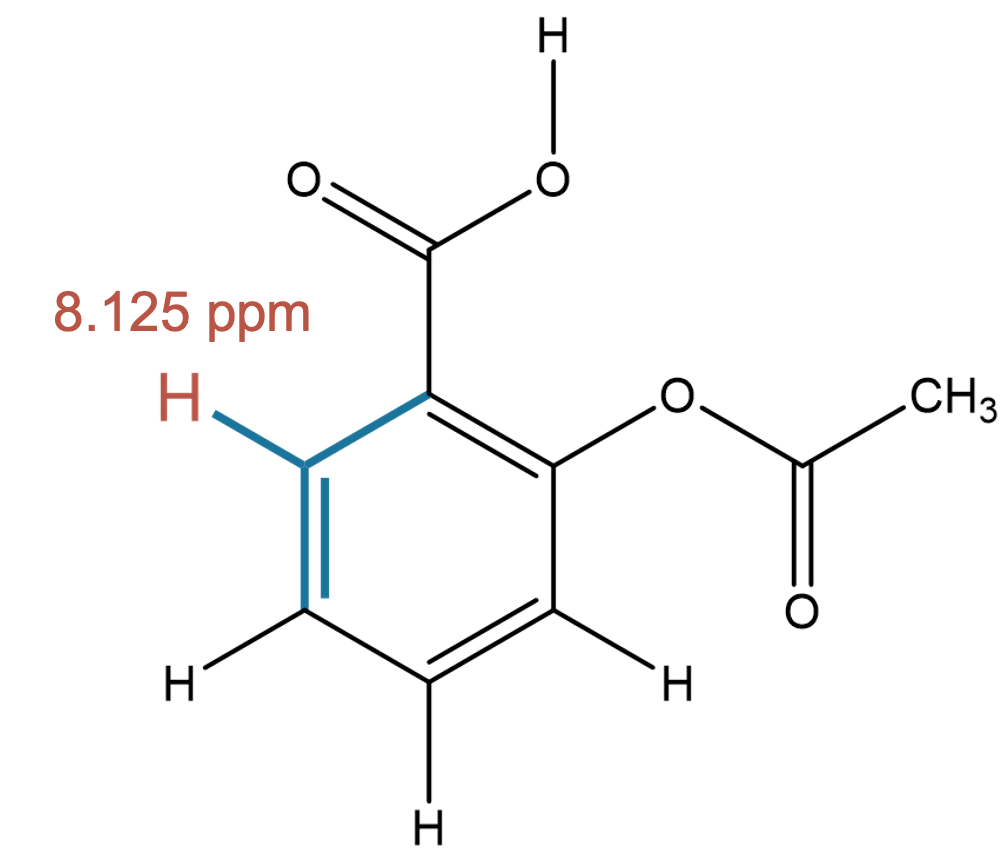
8.125 (1H)
|
|
|
|
Both solvent and gas-phase predictions correctly identify an aromatic proton adjacent to electron-withdrawing groups, showing minimal solvent sensitivity for this environment. |
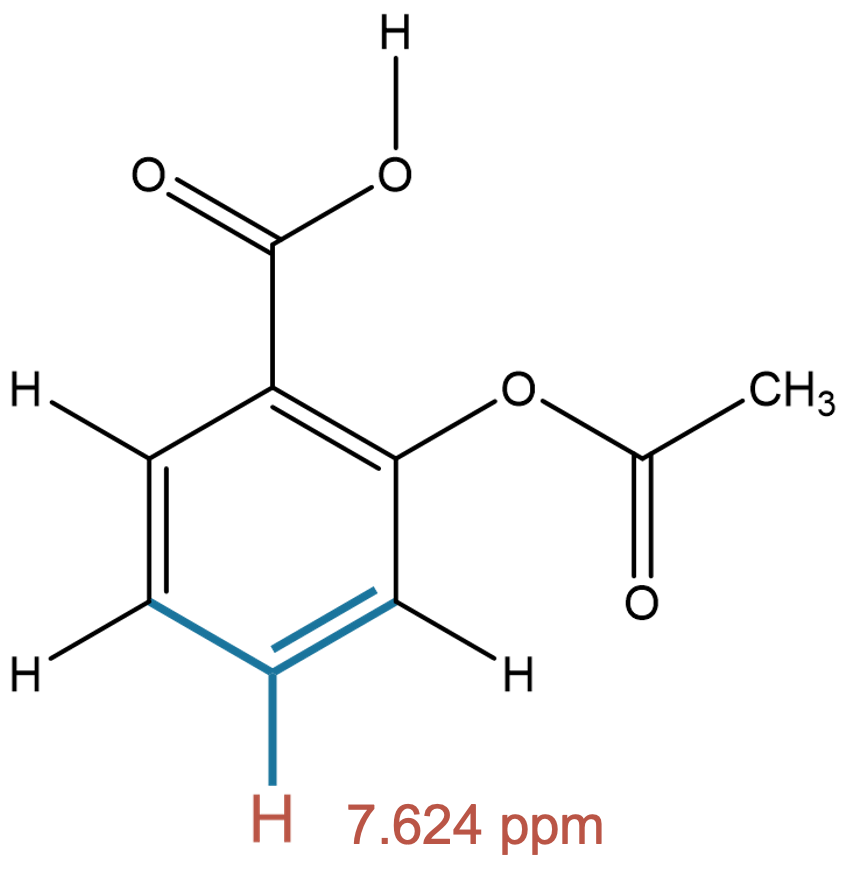
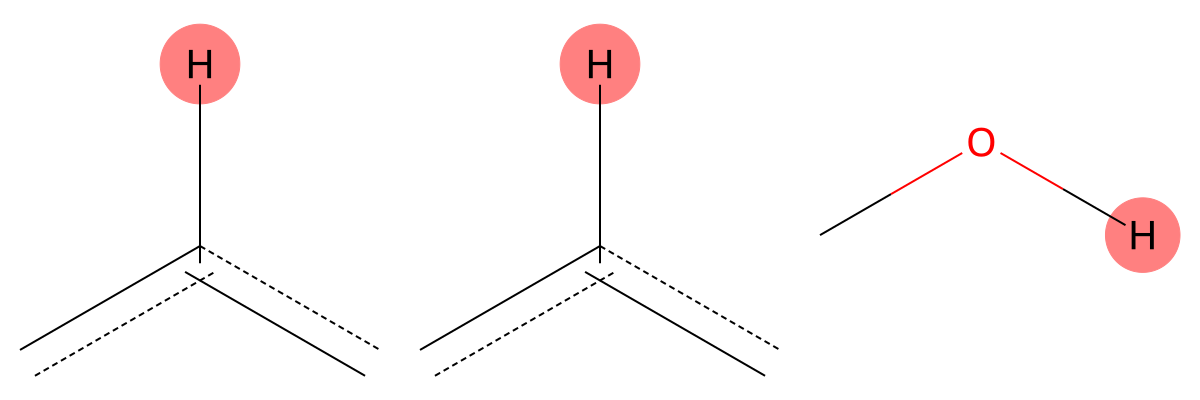
7.624 (1H)
|

|

|
|
The predicted aromatic environment is consistent across both solvents, indicating limited solvent dependence for this proton. |
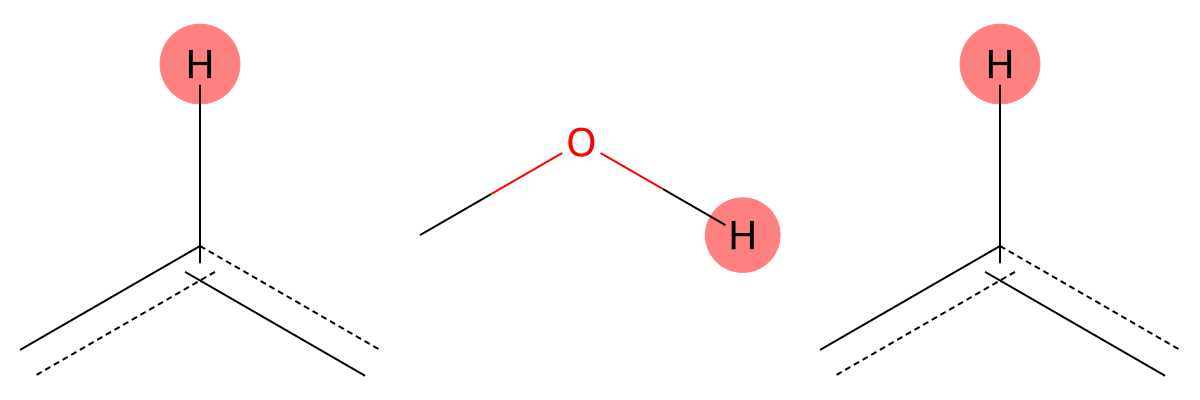
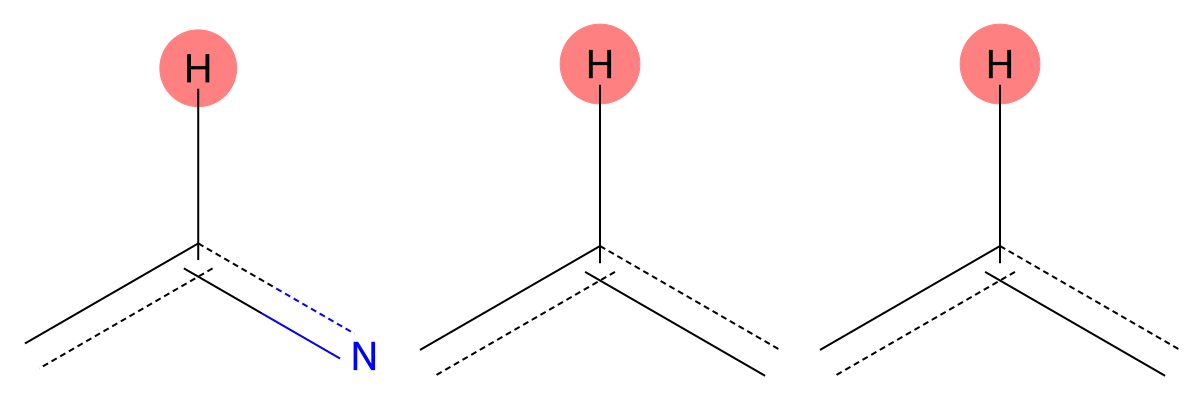
7.356 (1H)
|
|

|
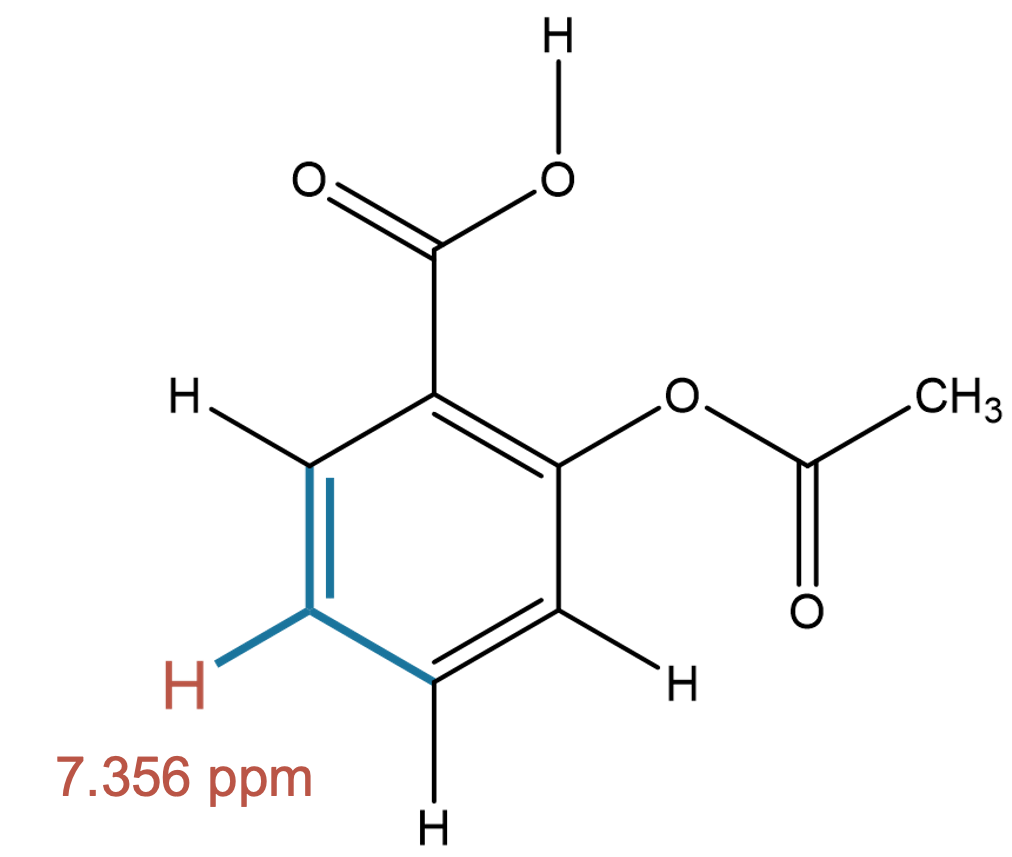
|
MID correctly captures the aromatic hydrogen environment in both cases, confirming robustness for neutral aromatic protons. |
7.142 (1H)
|
|
|
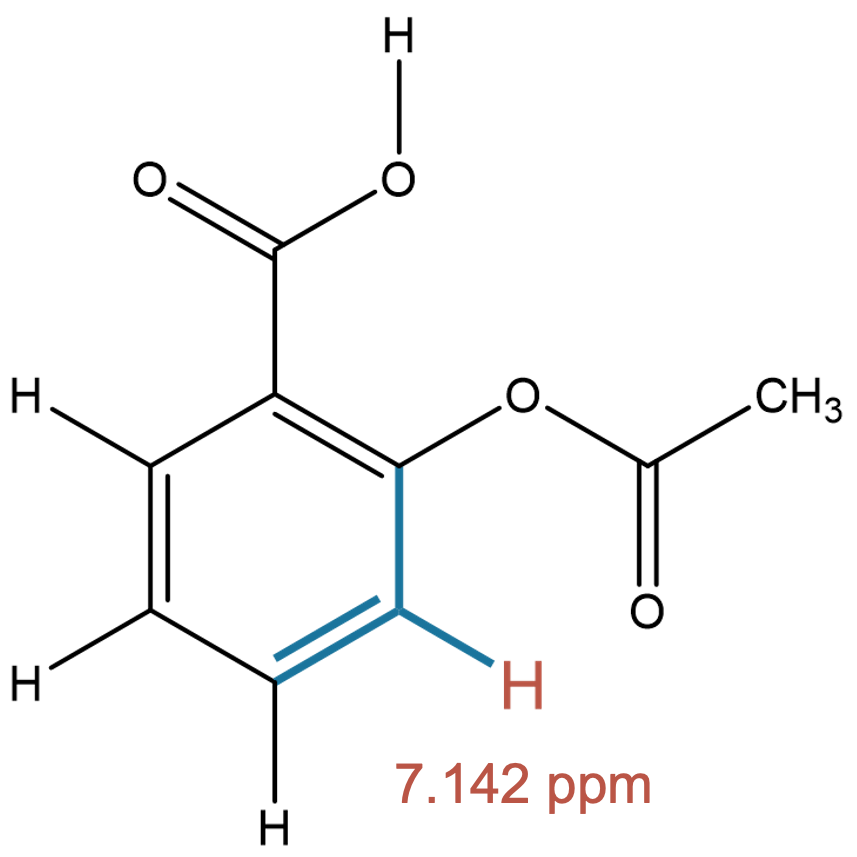
|
The predicted fragments closely match experiment, indicating negligible solvent influence for this aromatic proton. |
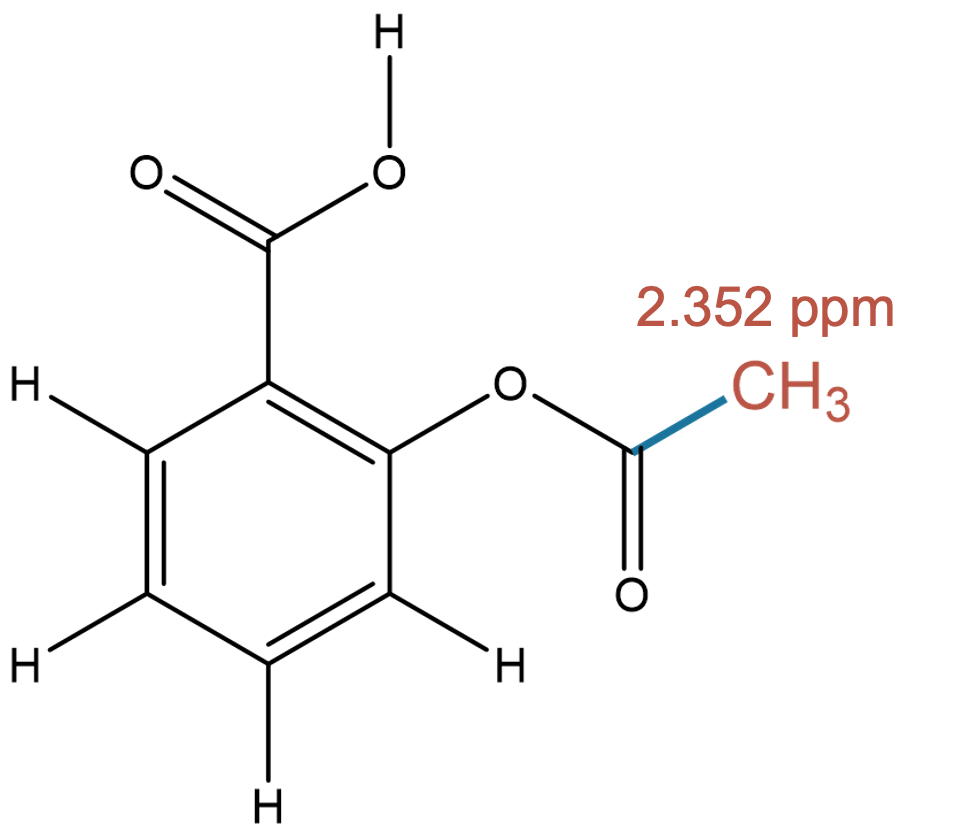
2.352 (3H)
|

|

|
|
Both models accurately identify the methyl group bonded to a carbonyl carbon, demonstrating strong agreement with experiment. |