NMR Spectrum Simulator Simulate NMR spectra directly from your molecular structure
Demo version — learn how the tool works before registering.
How Does This Tool Work?
The MID NMR Spectrum Simulator generates highly realistic simulated NMR spectra from molecular structures. Using advanced computational models and solvent-specific corrections, it estimates both ¹H and ¹³C chemical shifts and produces simulated spectra that closely resemble what would be observed experimentally.
The tool generates a variety of NMR spectra types, including:
- ¹H and ¹³C spectra
- Correlation spectroscopy (COSY)
- Heteronuclear single-quantum correlation (HSQC)
- Heteronuclear multiple-bond correlation (HMBC)
This allows you to investigate the expected NMR features of a molecule before or alongside actual laboratory experiments, helping to guide structure verification and interpretation of your experimental data.
Why Use this Tool
The MID NMR Spectrum Simulator provides experimental chemists with a way to directly connect molecular structures to NMR spectra.
By simulating the ¹H and ¹³C spectra of molecules, the tool allows you to visualize how different structural motifs influence chemical shifts and signal patterns. This can be particularly useful when you want to compare the spectra of a molecule you hypothesize with the spectra obtained from a synthesized compound, helping to confirm or refine your structural assignments.
Additionally, the simulator offers insights into correlation experiments such as COSY, HSQC, and HMBC, enabling you to explore signal relationships and identify key structural features even before performing full NMR experiments.
2-Aminopyridine
This example demonstrates the use of the MID NMR Simulator, which generates simulated NMR spectra directly from a molecular structure. The simulator estimates ¹H and ¹³C chemical shifts using quantum-chemical models combined with solvent-specific corrections.
The predicted spectra are compared with experimental NMR data obtained from the AIST/SDBS database for 2-aminopyridine.
Step 1: Molecular Structure Input
The MID NMR Simulator starts from a molecular structure. The molecule can be entered by drawing it in the integrated editor or by importing a structure file (e.g. SMILES or MOL format).
In this example, 2-aminopyridine was used as input.
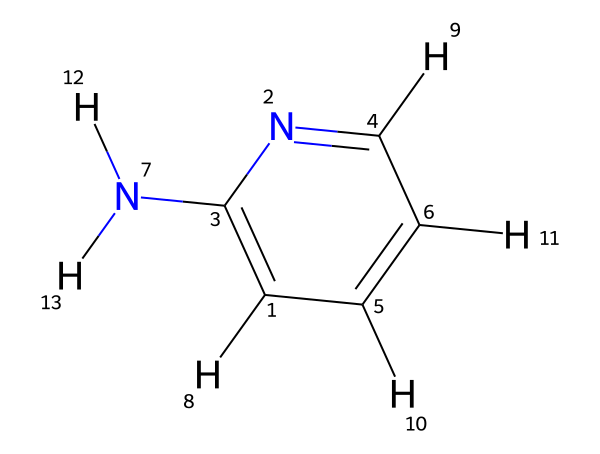
Figure 1. Molecular structure of 2-aminopyridine used as input for the MID NMR Simulator.
Step 2: Experimental Conditions
Before generating the spectra, the experimental conditions must be specified:
- Operating frequency (MHz) of the NMR spectrometer
- Solvent used in the NMR experiment
These parameters are essential, as magnetic field strength and solvent effects significantly influence chemical shifts.
For this example, the operating frequency was set to 300 MHz and chloroform (CDCl3) was chosen as the solvent.
Step 3: Spectrum Prediction
Once the structure and experimental conditions are defined, the molecule can be submitted by clicking the Submit molecule button. Then, the simulator calculates chemical shifts and generates the following simulated spectra:
- ¹H-NMR
- ¹³C-NMR
- COSY
- HSQC
- HMBC
In addition, two tables are generated containing the predicted ¹H and ¹³C chemical shifts and the corresponding ¹H-¹H coupling information.
Results and Experimental Validation
To verify the robustness of the MID methodology the ¹H-NMR and ¹³C-NMR predicted spectra were compared with the experimentally assigned peaks in the 2-aminopyridine molecule in chloroform.
The results show how the MID NMR Simulator can reliably generate realistic simulated NMR spectra directly from a molecular structure. The close agreement between predicted and experimental data confirms the suitability of the tool for structure validation and spectral interpretation.
¹H-NMR
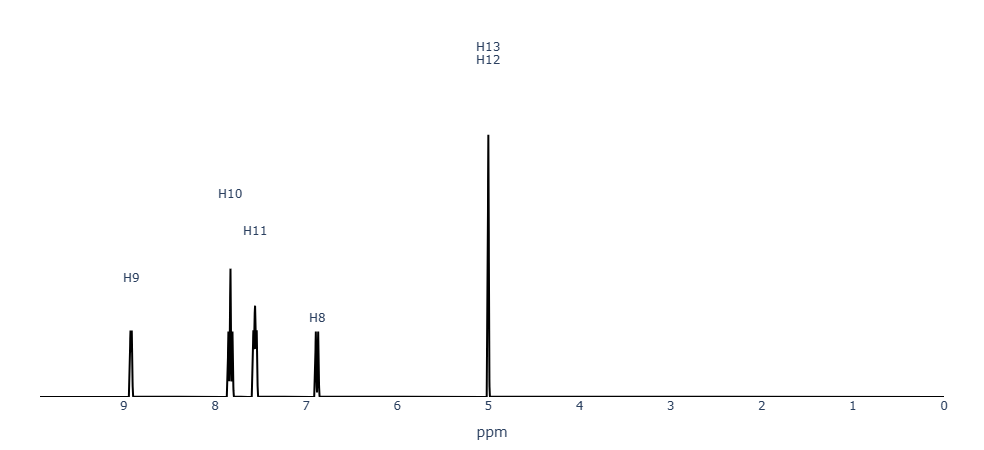
Figure 2. MID Predicted ¹H-NMR spectra of 2-aminopyridine.
| Hydrogen | MID Prediction (ppm) | Experimental (ppm) |
|---|---|---|
| H8 | 6.88 ± 0.47 | 6.469 |
| H9 | 8.92 ± 0.59 | 8.049 |
| H10 | 7.83 ± 0.30 | 7.379 |
| H11 | 7.56 ± 0.40 | 6.605 |
| H12 | 5.00 ± 0.52 | 4.630 |
| H13 | 5.00 ± 0.52 | 4.630 |
The predicted ¹H chemical shifts closely reproduce the experimental values.
¹³C-NMR
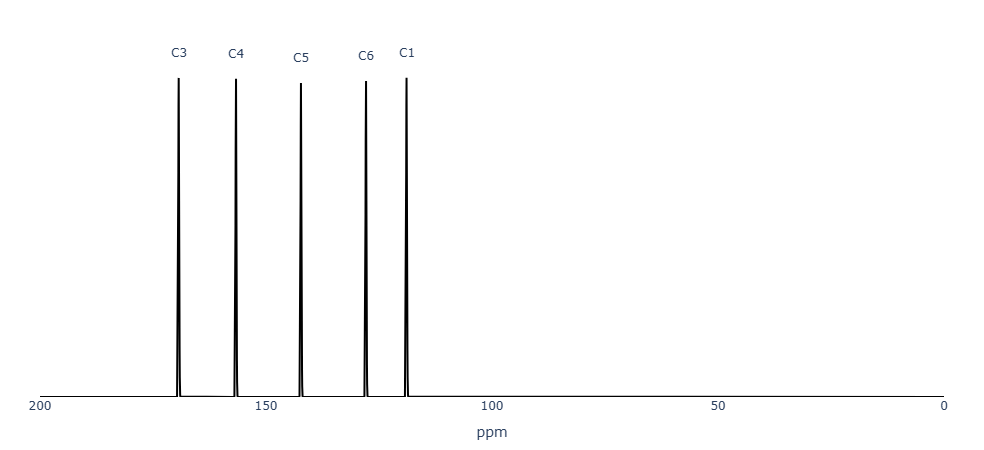
Figure 3. MID Simulator ¹³C-NMR spectra of 2-aminopyridine.
| Carbon | MID Prediction (ppm) | Experimental (ppm) |
|---|---|---|
| C1 | 118.90 ± 8.95 | 108.66 |
| C3 | 169.31 ± 4.14 | 158.85 |
| C4 | 156.64 ± 7.64 | 147.37 |
| C5 | 142.25 ± 2.00 | 137.66 |
| C6 | 127.88 ± 4.90 | 113.67 |
The ¹³C-NMR predictions show good agreement with experimental values, capturing both aromatic and heteroatom-substituted carbon environments.
2-Aminopyridine with methanol
To demonstrate the tool’s ability to capture minor impurities, we simulated the ¹H-NMR spectrum of 2-aminopyridine in chloroform (CDCl3) with a small amount of methanol (CH3OH) included.
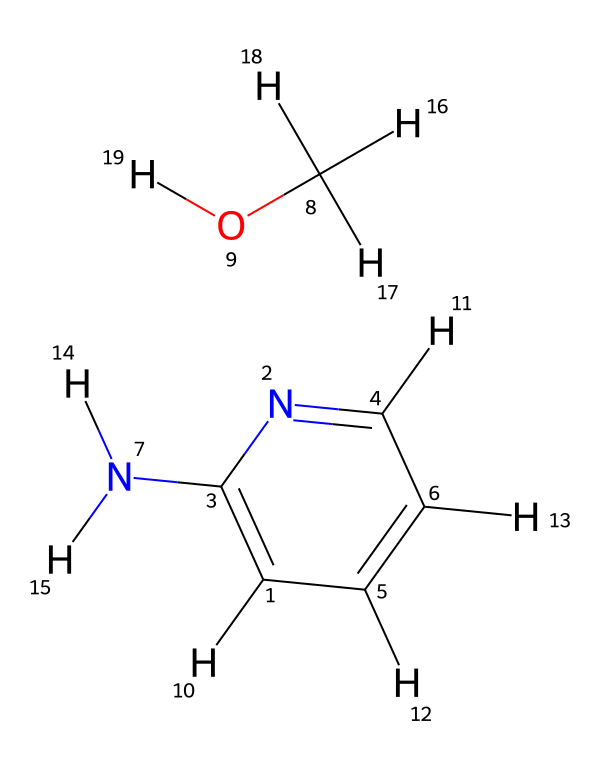
Figure 1. Molecular structure of 2-aminopyridine with methanol used as input for the MID NMR Simulator.
By including the structure of minor impurities or residual solvents alongside the main molecule, the MID Simulator can generate signals corresponding to these species in the predicted spectrum.
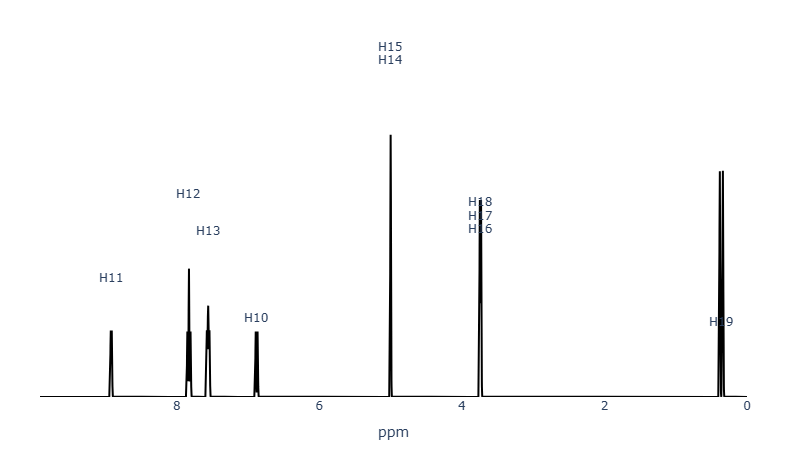
Figure 2. MID Simulator ¹H-NMR spectrum of 2-aminopyridine in chloroform (CDCl3) with methanol (CH3OH) included.
The two additional signals indicate the presence of methanol.
The MID Simulator correctly identifies the primary proton signals of 2-aminopyridine and also captures the signals corresponding to methanol. This example highlights the tool’s sensitivity to minor impurities and its utility in spectral validation.