An IR spectrum is a list of the bonds in your molecule written in wavenumbers. The hard part is usually reading it backwards: looking at a band and working out which bond it belongs to. The IR Spectrum Simulator makes that easier because every band it predicts is labeled with the atoms of the bond that produces it.
This guide walks through one example, acetophenone, from drawing the structure to reading the labels.
Drawing the molecule
Open Simulators, IR, Spectrum Simulator. The page uses the same structure editor as the NMR simulator. You can draw the molecule, paste a SMILES string (acetophenone is CC(=O)c1ccccc1) or open a MOL file. Unlike the NMR simulator, there are no settings to choose. Press Submit Molecule and the prediction appears after a few seconds.
The numbered structure
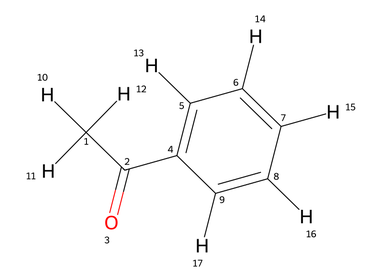
As in the NMR simulator, the result starts with your molecule drawn with all atoms numbered. The labels on the spectrum use these numbers, so this picture is your key. In acetophenone, C1 is the methyl carbon with H10 to H12, C2 is the carbonyl carbon double bonded to O3, C4 is the ring carbon attached to the carbonyl, and C5 to C9 are the remaining ring carbons, each carrying one hydrogen (H13 to H17).
Reading the spectrum
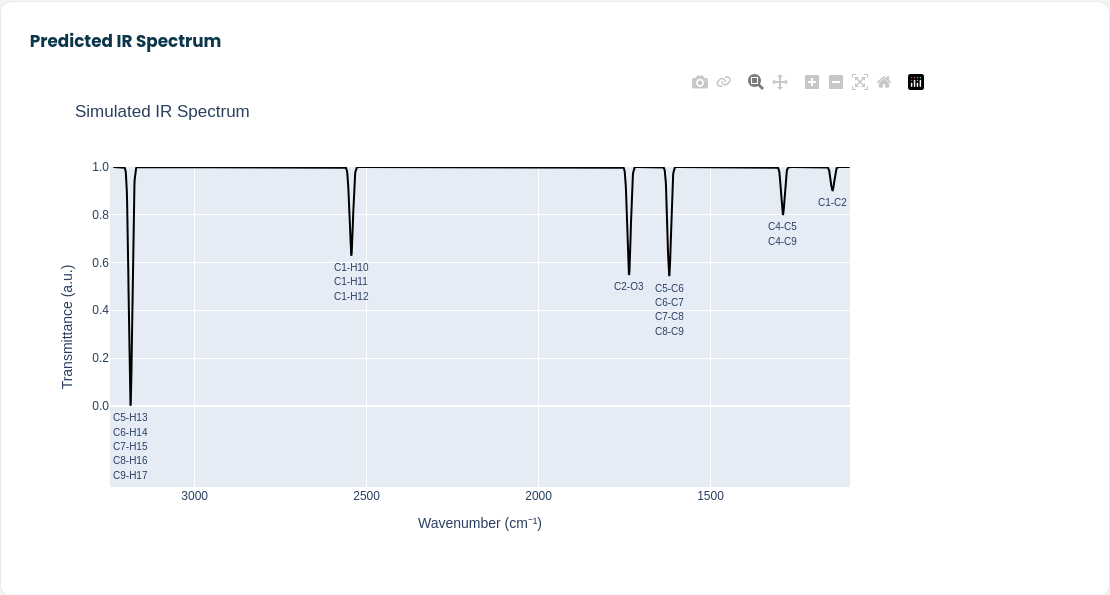
The spectrum is drawn the way IR spectra are normally shown: wavenumber decreasing from left to right and transmittance on the vertical axis, so absorptions point downward. The horizontal axis covers the range where bands are predicted for your molecule, so it changes from one molecule to the next.
Under each band you will find one or more labels like C2-O3. Each label is a bond, written as the two atoms it connects. Going from left to right in the acetophenone spectrum:
- C5-H13 to C9-H17: the five C-H bonds of the aromatic ring, at the high wavenumber end.
- C1-H10 to C1-H12: the three C-H bonds of the methyl group.
- C2-O3: the carbonyl double bond.
- C5-C6 to C8-C9: the bonds inside the aromatic ring.
- C4-C5 and C4-C9: the ring bonds next to the carbonyl substituent.
- C1-C2: the single bond between the methyl group and the carbonyl carbon.
When several bonds absorb at the same position, their labels are stacked under the same band, and their intensities add up. That is why the aromatic C-H band is the deepest one in this spectrum: five equivalent C-H bonds absorb together, while the carbonyl band comes from a single C=O bond. Keep this in mind when you compare band intensities. A deep band can mean one strongly absorbing bond or several weaker ones that coincide.
The plot is interactive. Drag across a region to zoom in, double click to zoom back out, hover over the curve to read exact wavenumbers, and use the camera icon to save the spectrum as an image.
Using the bond labels
The labels are the most useful part of the result, because they answer the question you normally have to work out by hand: which bond is responsible for this band?
A few ways to use them:
- Find a functional group. If your structure contains a carbonyl, a nitrile or an N-H, look for the label of that bond and see where the simulator places it. That tells you which region of your measured spectrum to look at.
- Tell substituents apart. Draw two candidate structures, for example two isomers with the same functional groups in different positions, and compare their predicted spectra. Bands that move or disappear between them are the ones worth checking in your measured data.
- Follow a structural change. Simulate a starting material and a product and compare them. A band that appears or disappears, such as a carbonyl that forms or a C-H that is lost, is often the quickest way to follow a reaction by IR.
- Teaching. Because every band is labeled, students can see straight away which part of a molecule produces which part of the spectrum, without a correlation table.
You can try the simulator at moleculeidentifier.com/predict_ir_LO.